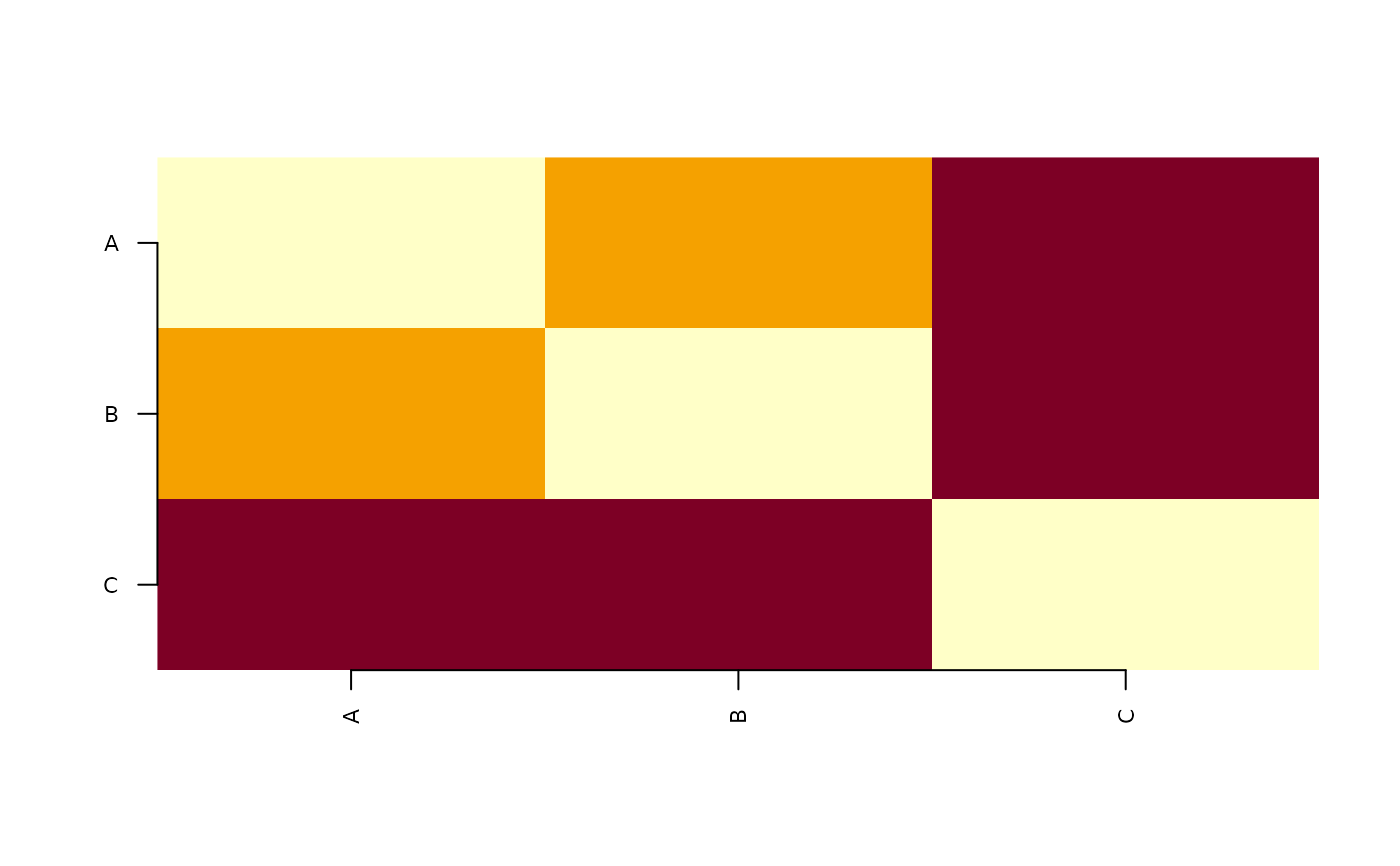
Plots the co-occurrence matrix as a heatmap, an igraph network, or a
base-R degree distribution.
Usage
# S3 method for class 'cooccurrence'
plot(x, type = c("heatmap", "network", "degree"), ...)
Arguments
- x
A cooccurrence data frame.
- type
Character. "heatmap" (default), "network"
(requires igraph), or "degree" for a base-R degree
distribution bar plot.
- ...
Passed to the plotting function.
Value
Invisibly returns x.