TNA Plotting Gallery and Visual Smoke Test
Mohammed Saqr and Sonsoles López-Pernas
Source:vignettes/articles/plotting-tna-models.Rmd
plotting-tna-models.RmdThis page is an executable visual smoke test for the complete plotting surface of tna and its integration with cograph. Knitting stops on the first plotting error. Statistical resampling uses deliberately small iteration counts so that the page can be rebuilt during development; the results below are for visual and API verification, not inference.
The gallery covers:
-
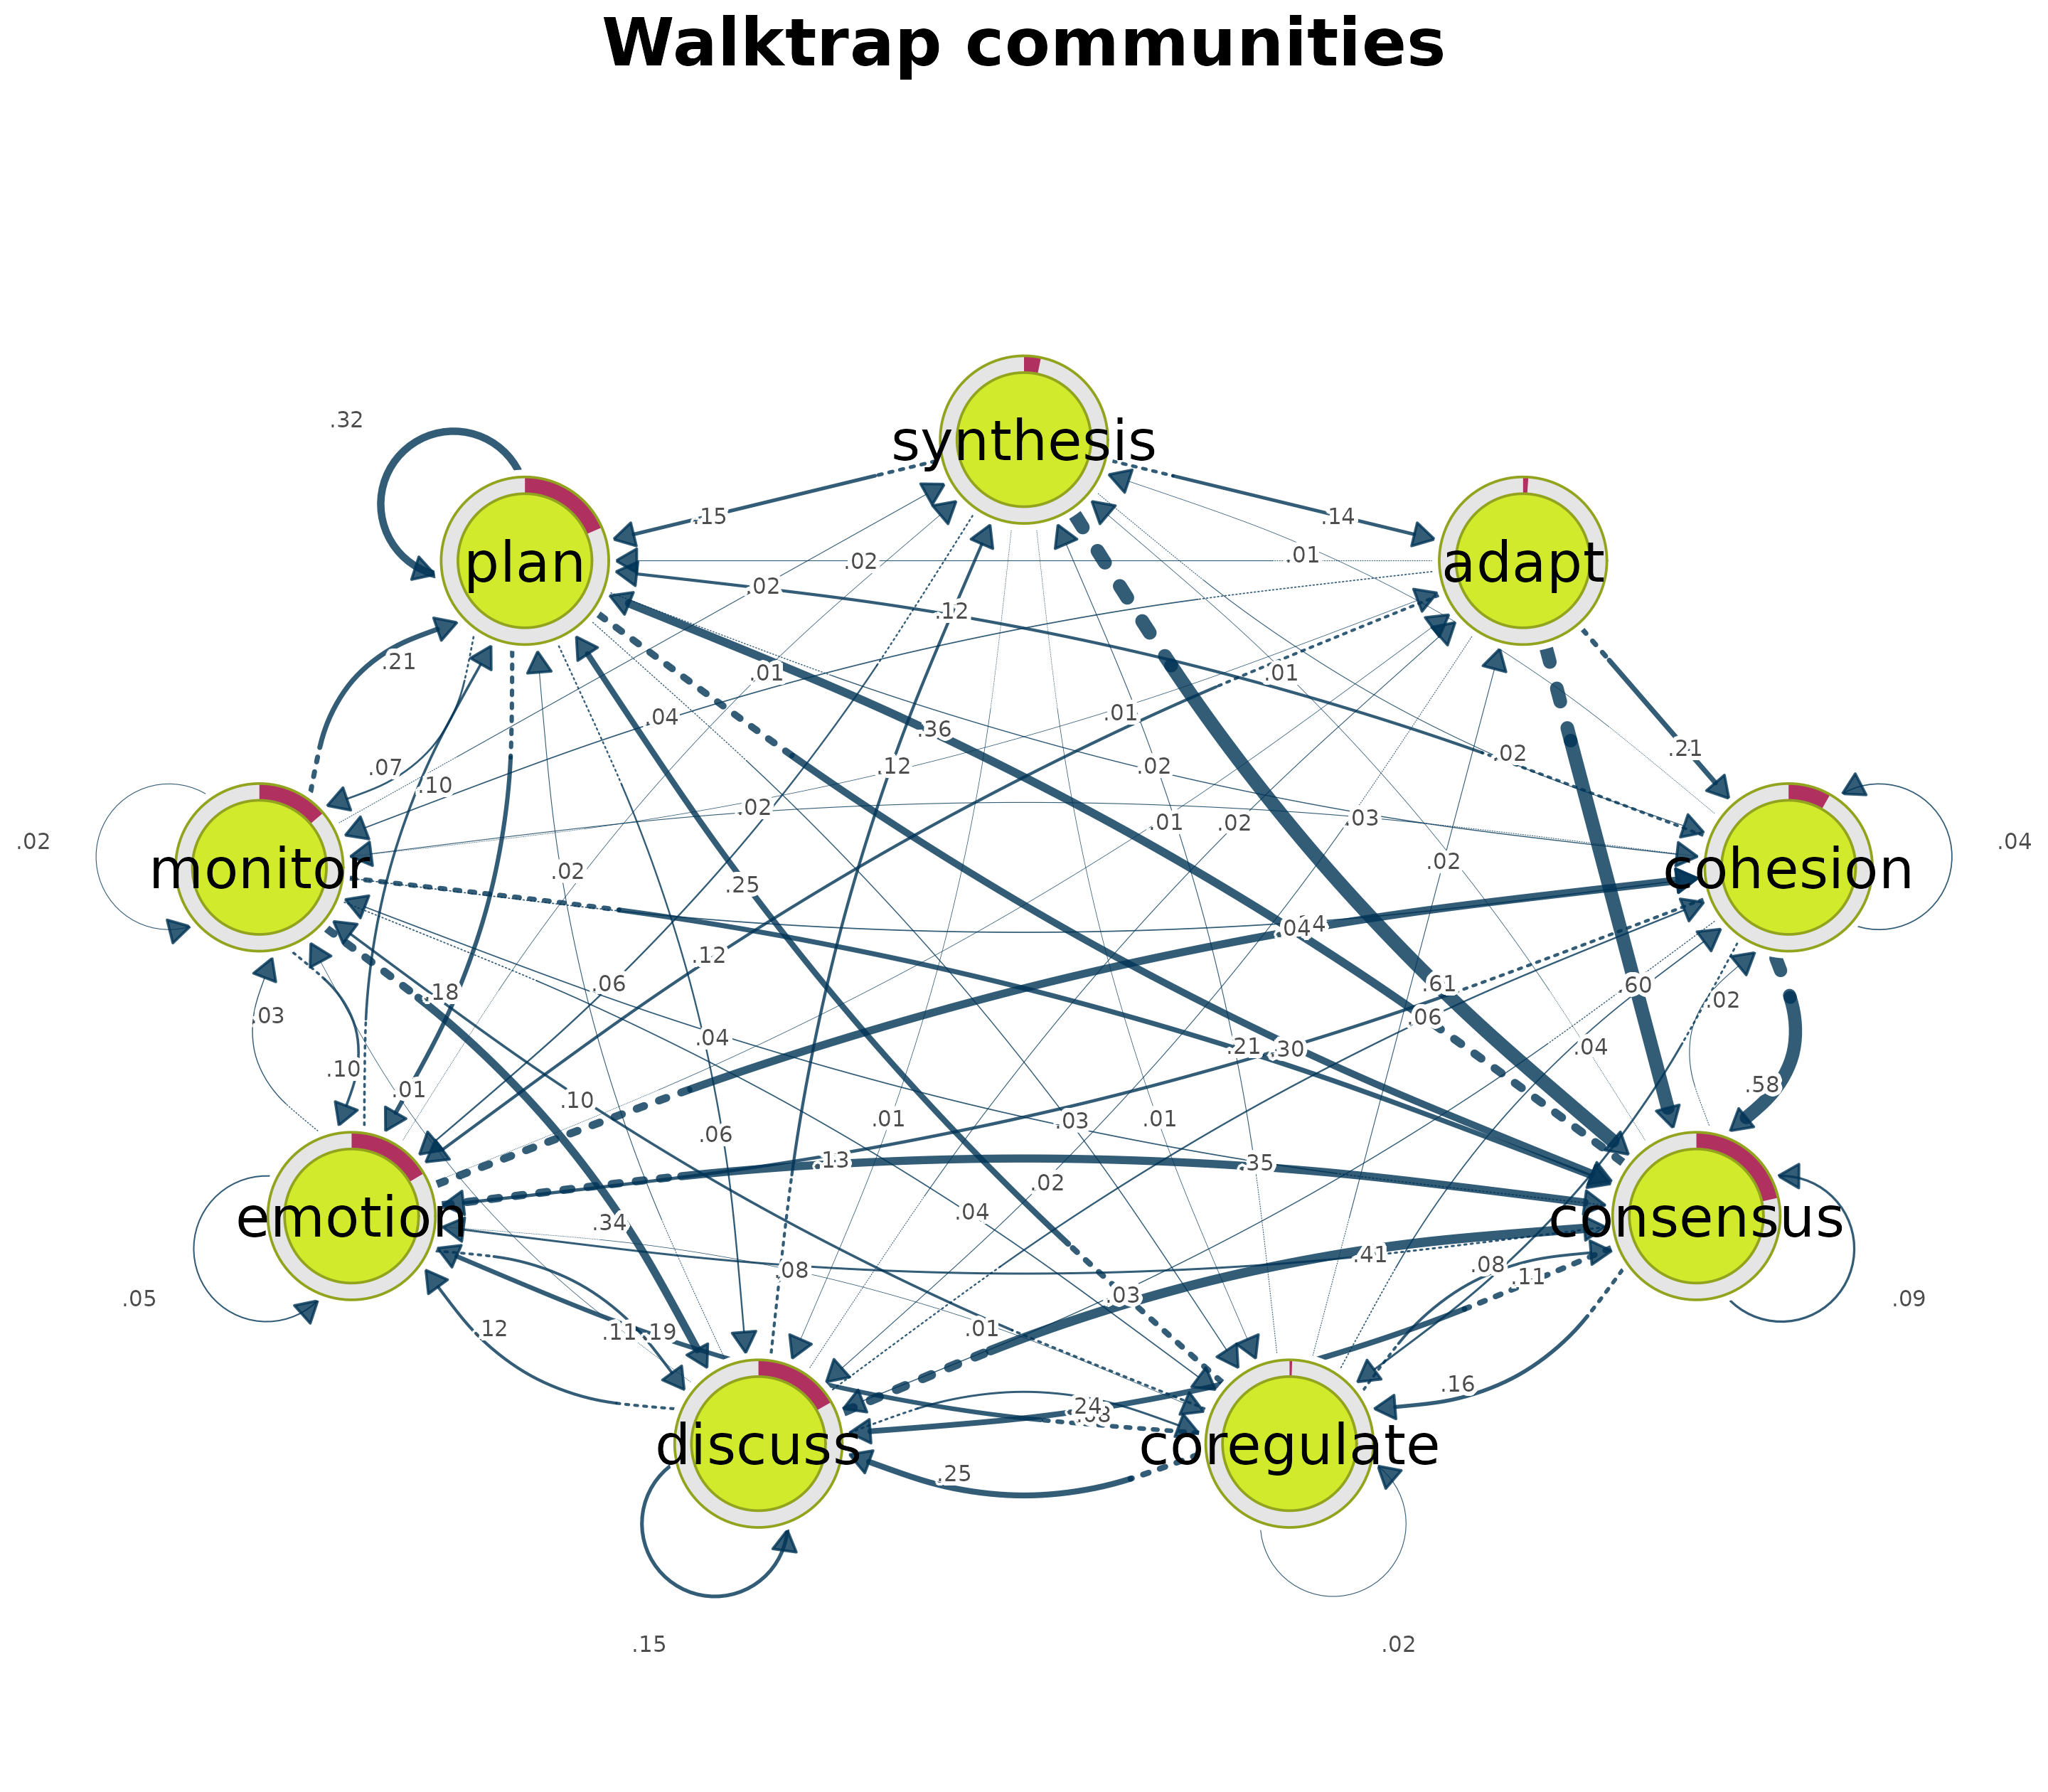
plot()for single and grouped TNA models, bootstrap objects, centralities, cliques, communities, comparisons, permutations, reliability, sequence comparisons, and stability objects; -
hist(),plot_model(),plot_compare(),plot_frequencies(),plot_mosaic(),plot_sequences(), andplot_associations(); - cograph’s enhanced TNA bootstrap, difference, permutation, forest, and heterogeneous-network renderers.
data.frame(
  package = c("tna", "cograph"),
  version = c(
    as.character(utils::packageVersion("tna")),
    as.character(utils::packageVersion("cograph"))
  )
)
#>   package version
#> 1     tna   1.3.1
#> 2 cograph   2.7.8
Shared fixtures
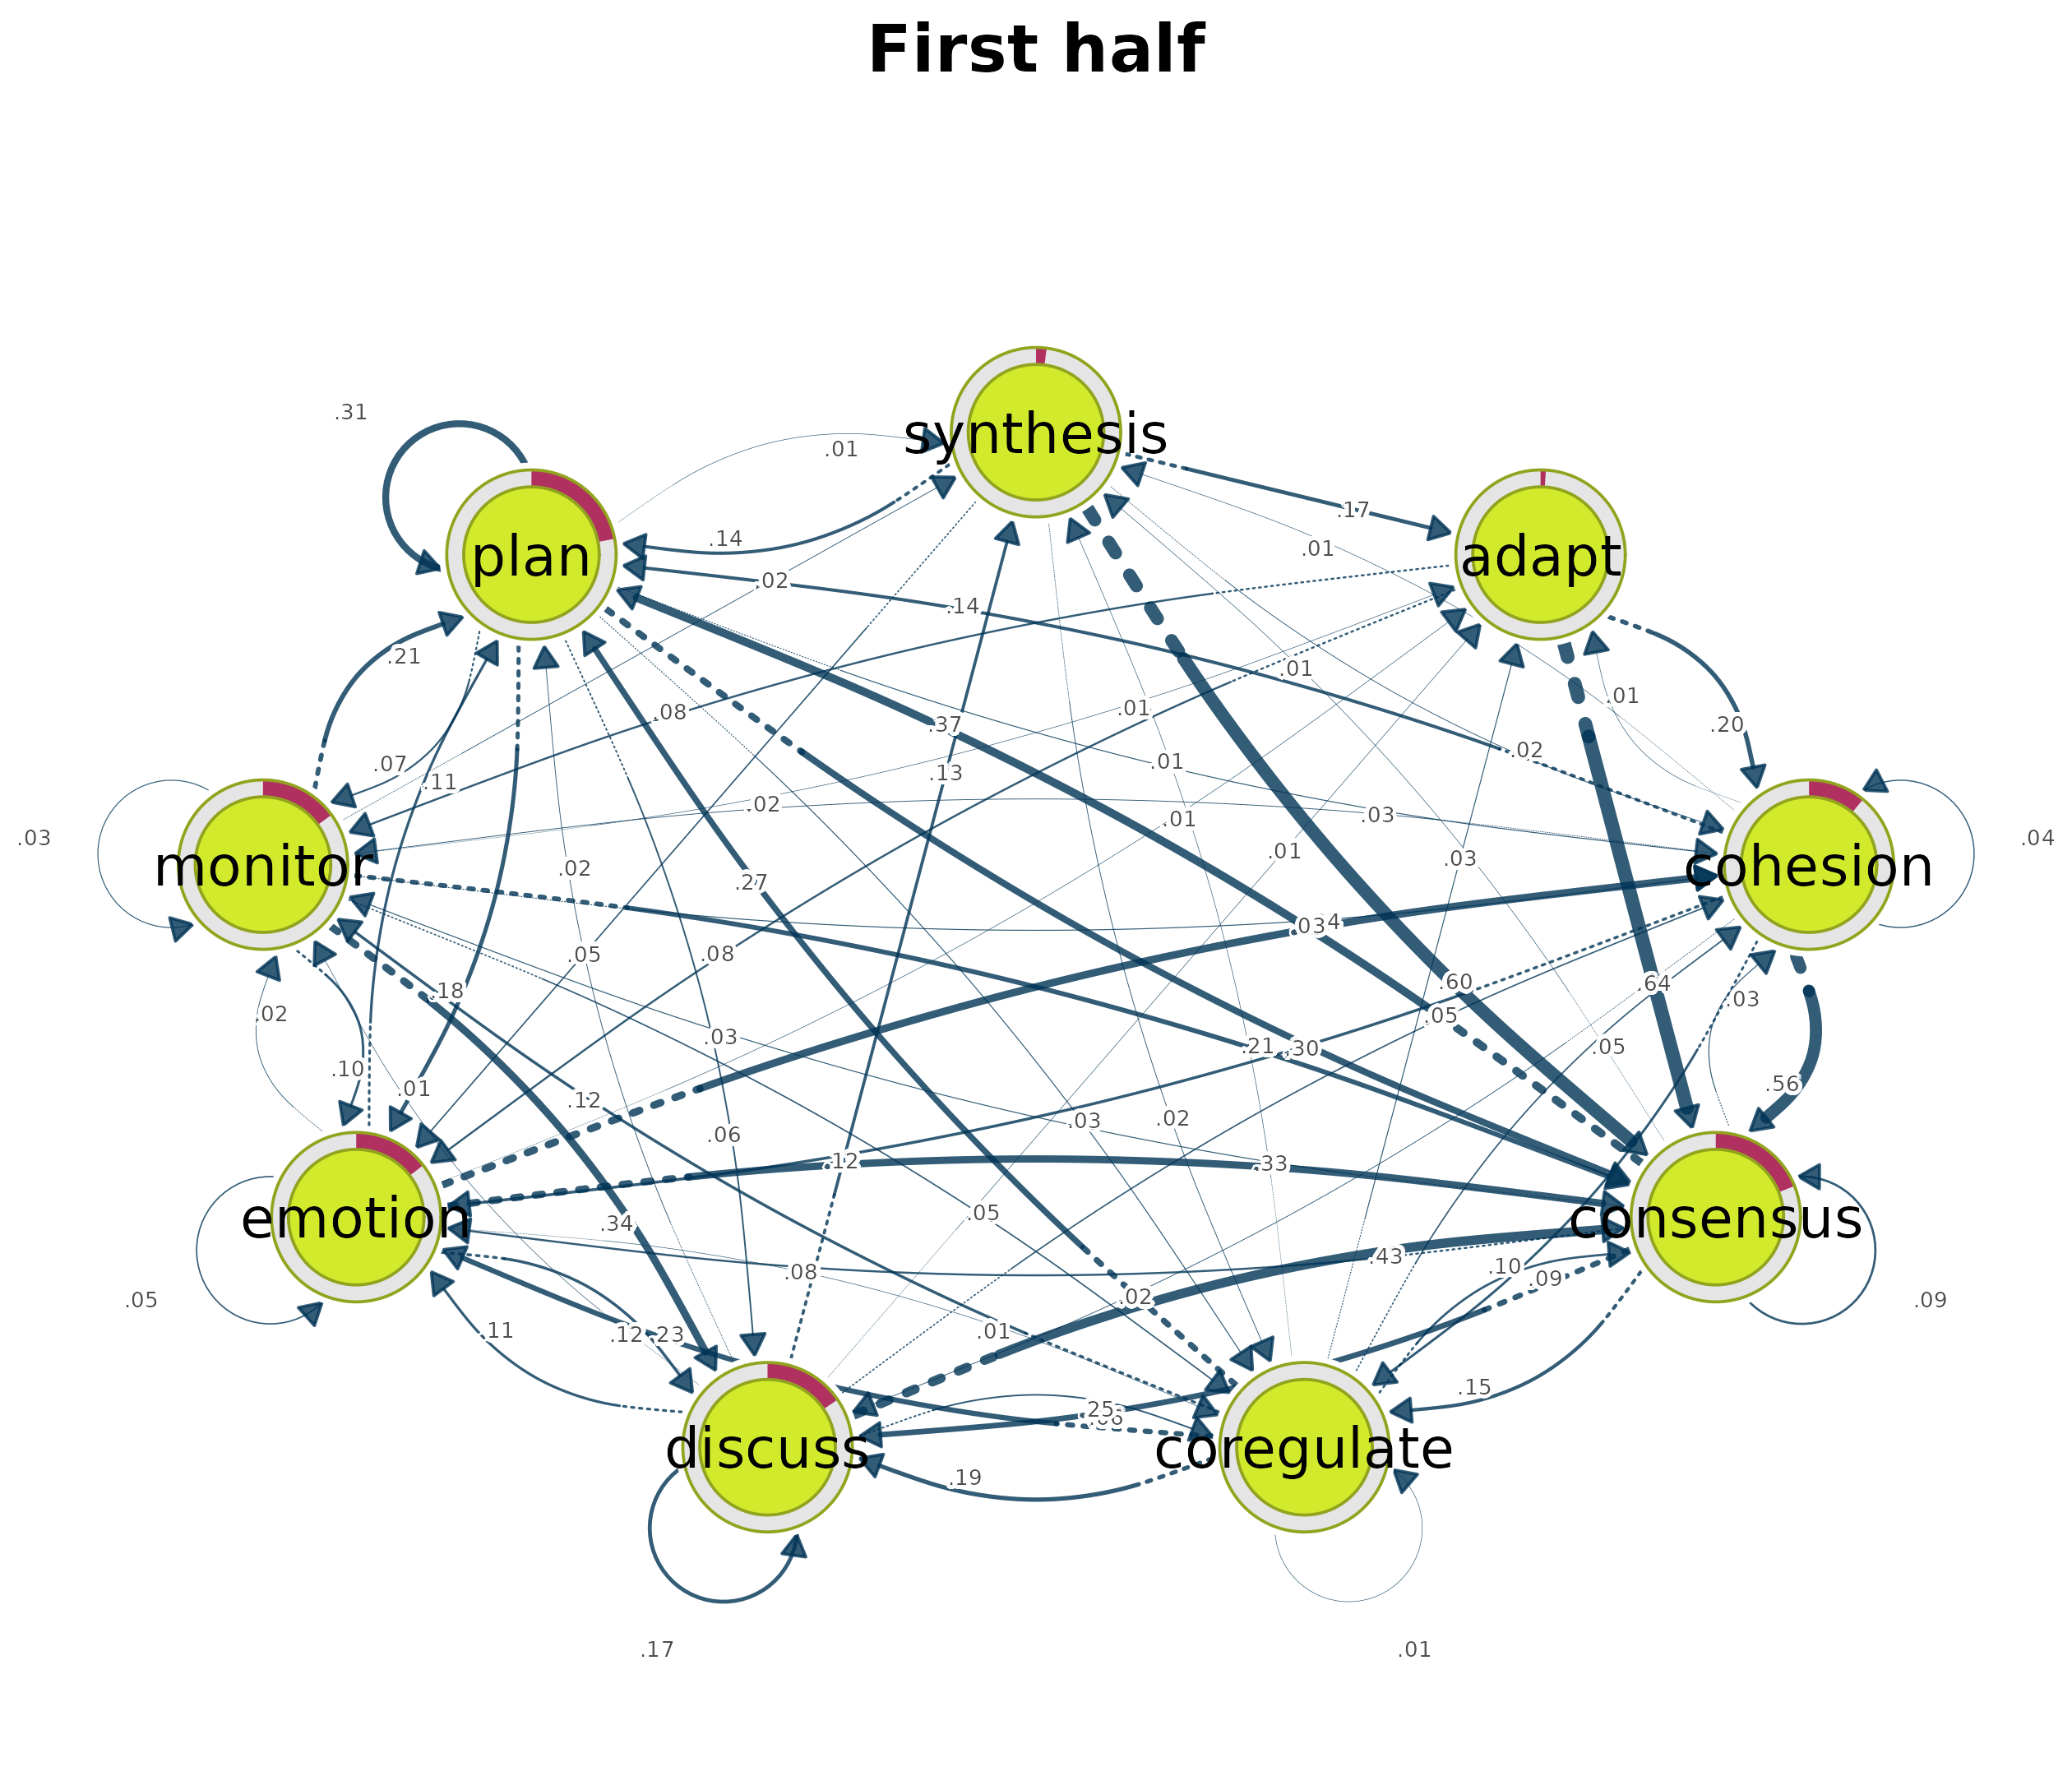
The fixtures use 400 rows from group_regulation, split
into two groups. This is large enough to exercise real TNA objects while
keeping resampling fast.
Core network plots
Single TNA model
Exercises plot.tna() and its default cograph
renderer.
plot(model, title = "Single TNA model", minimum = 0.05)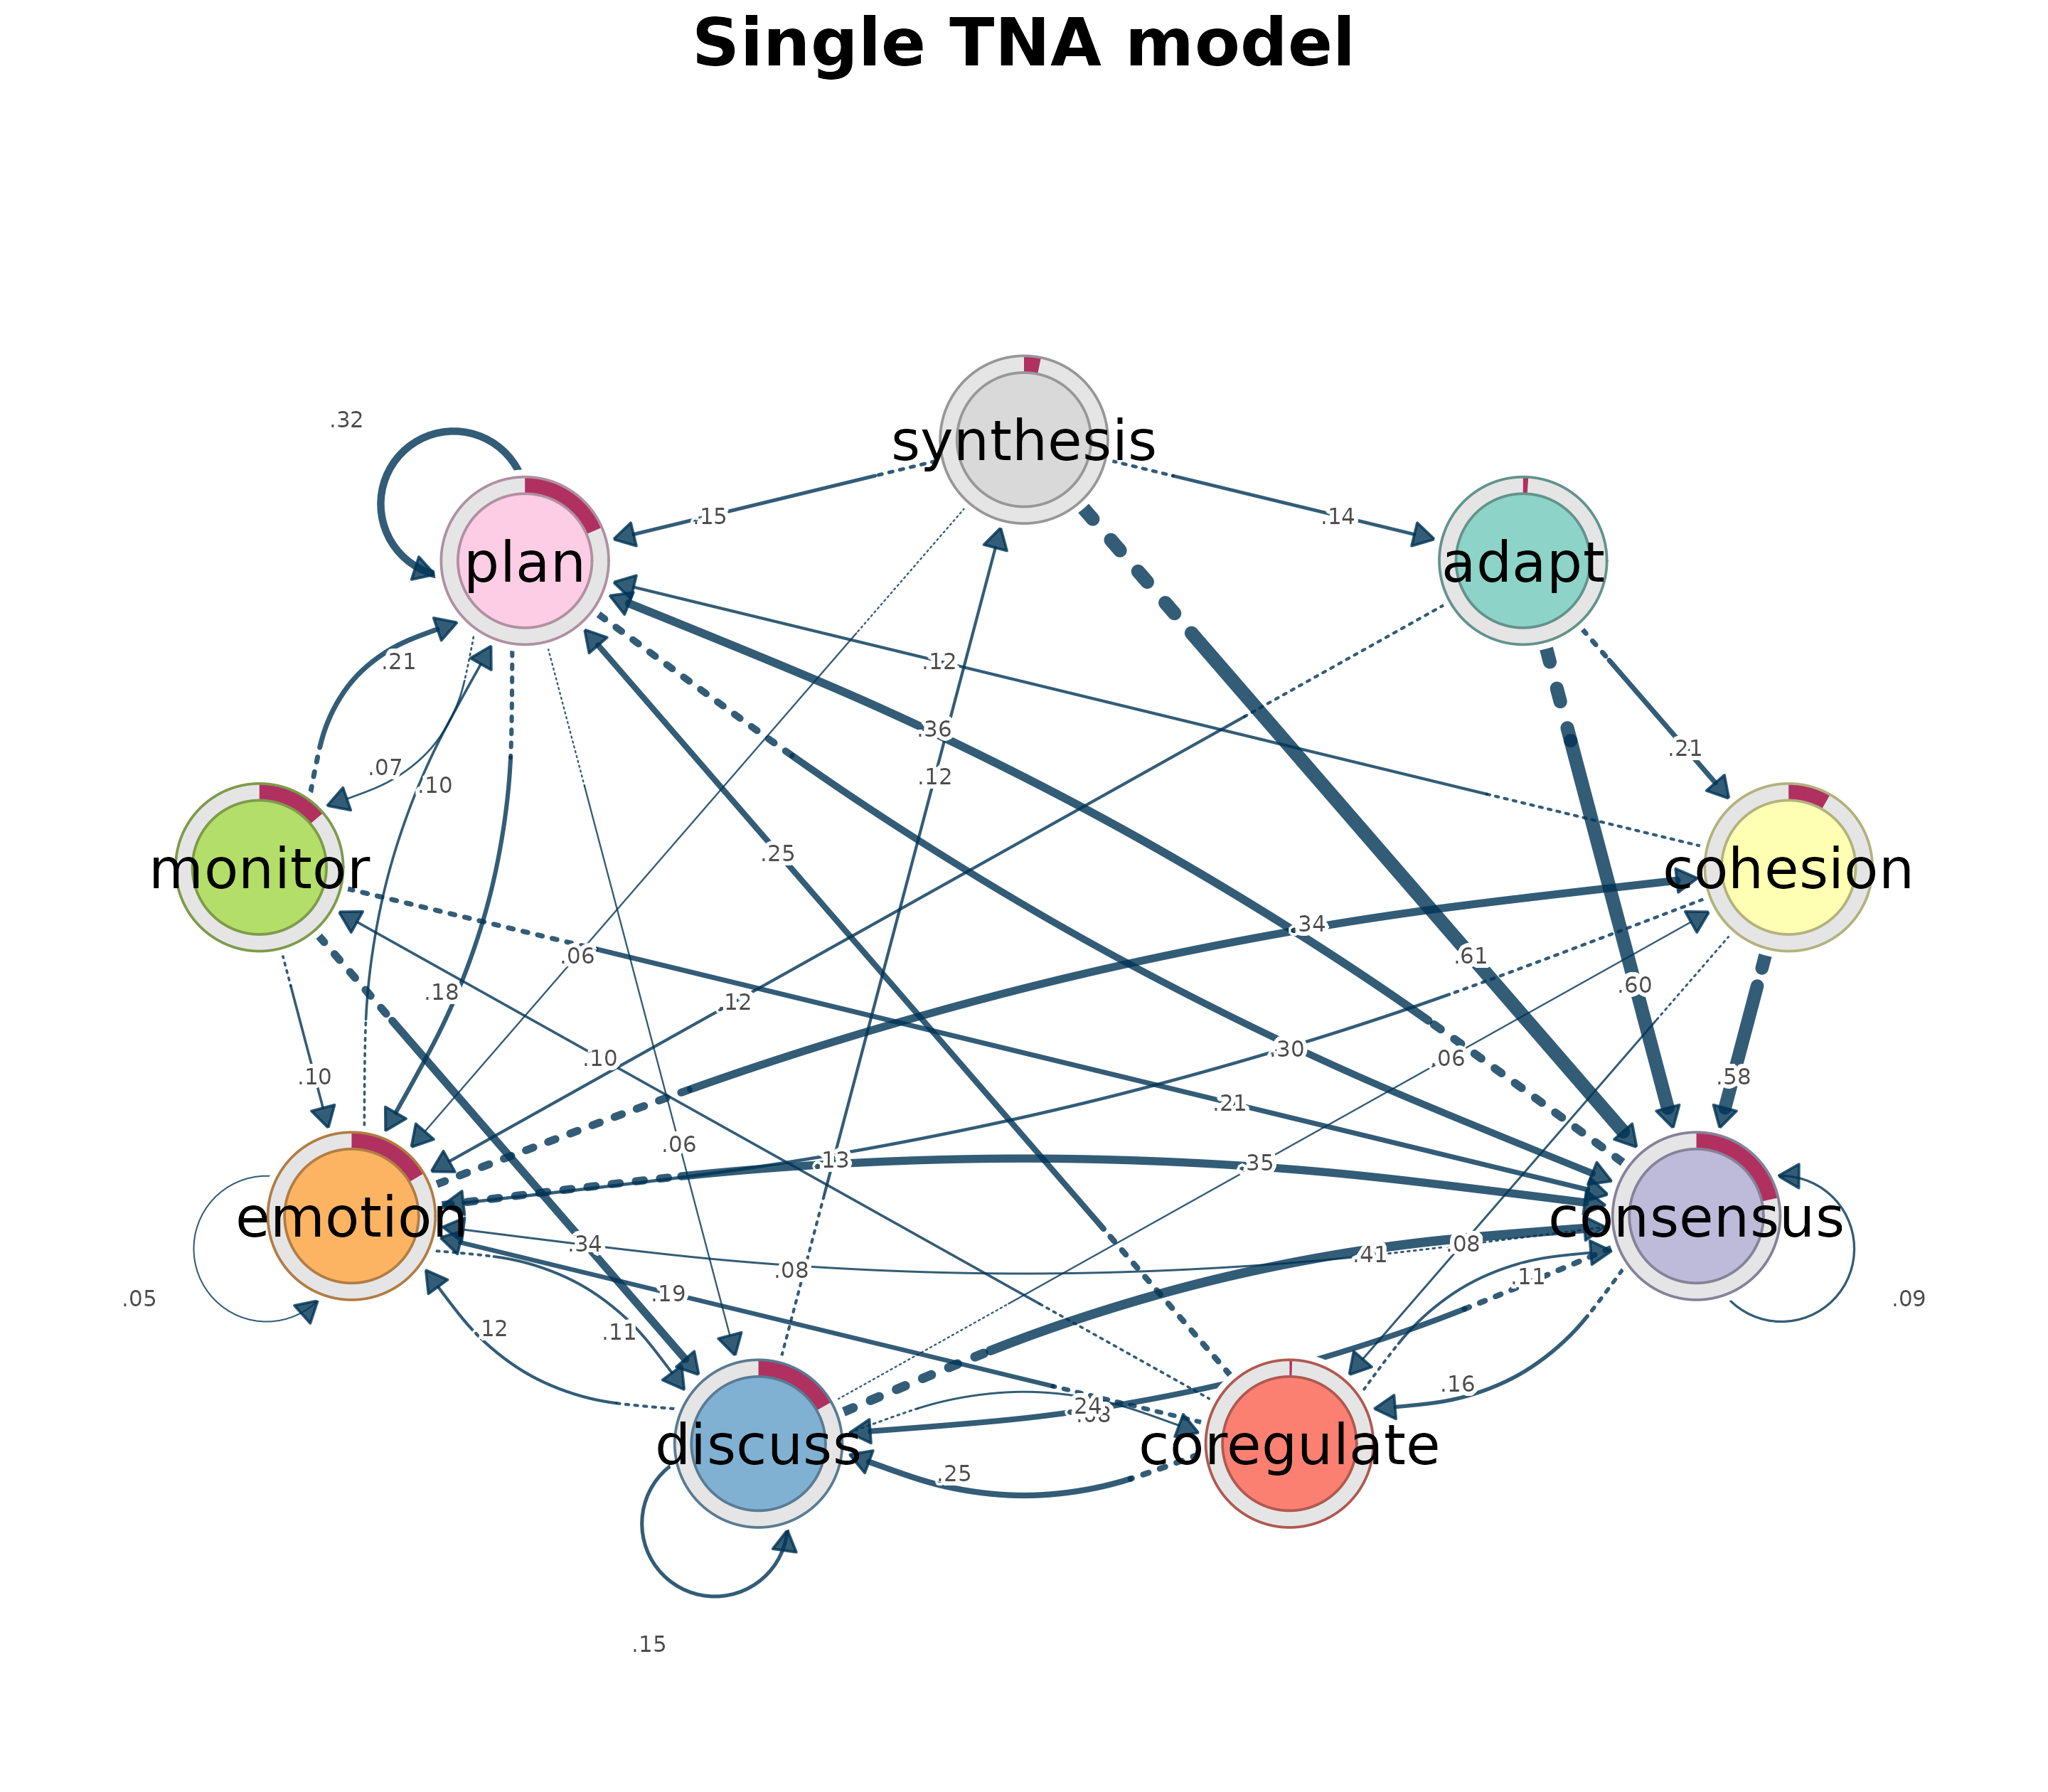
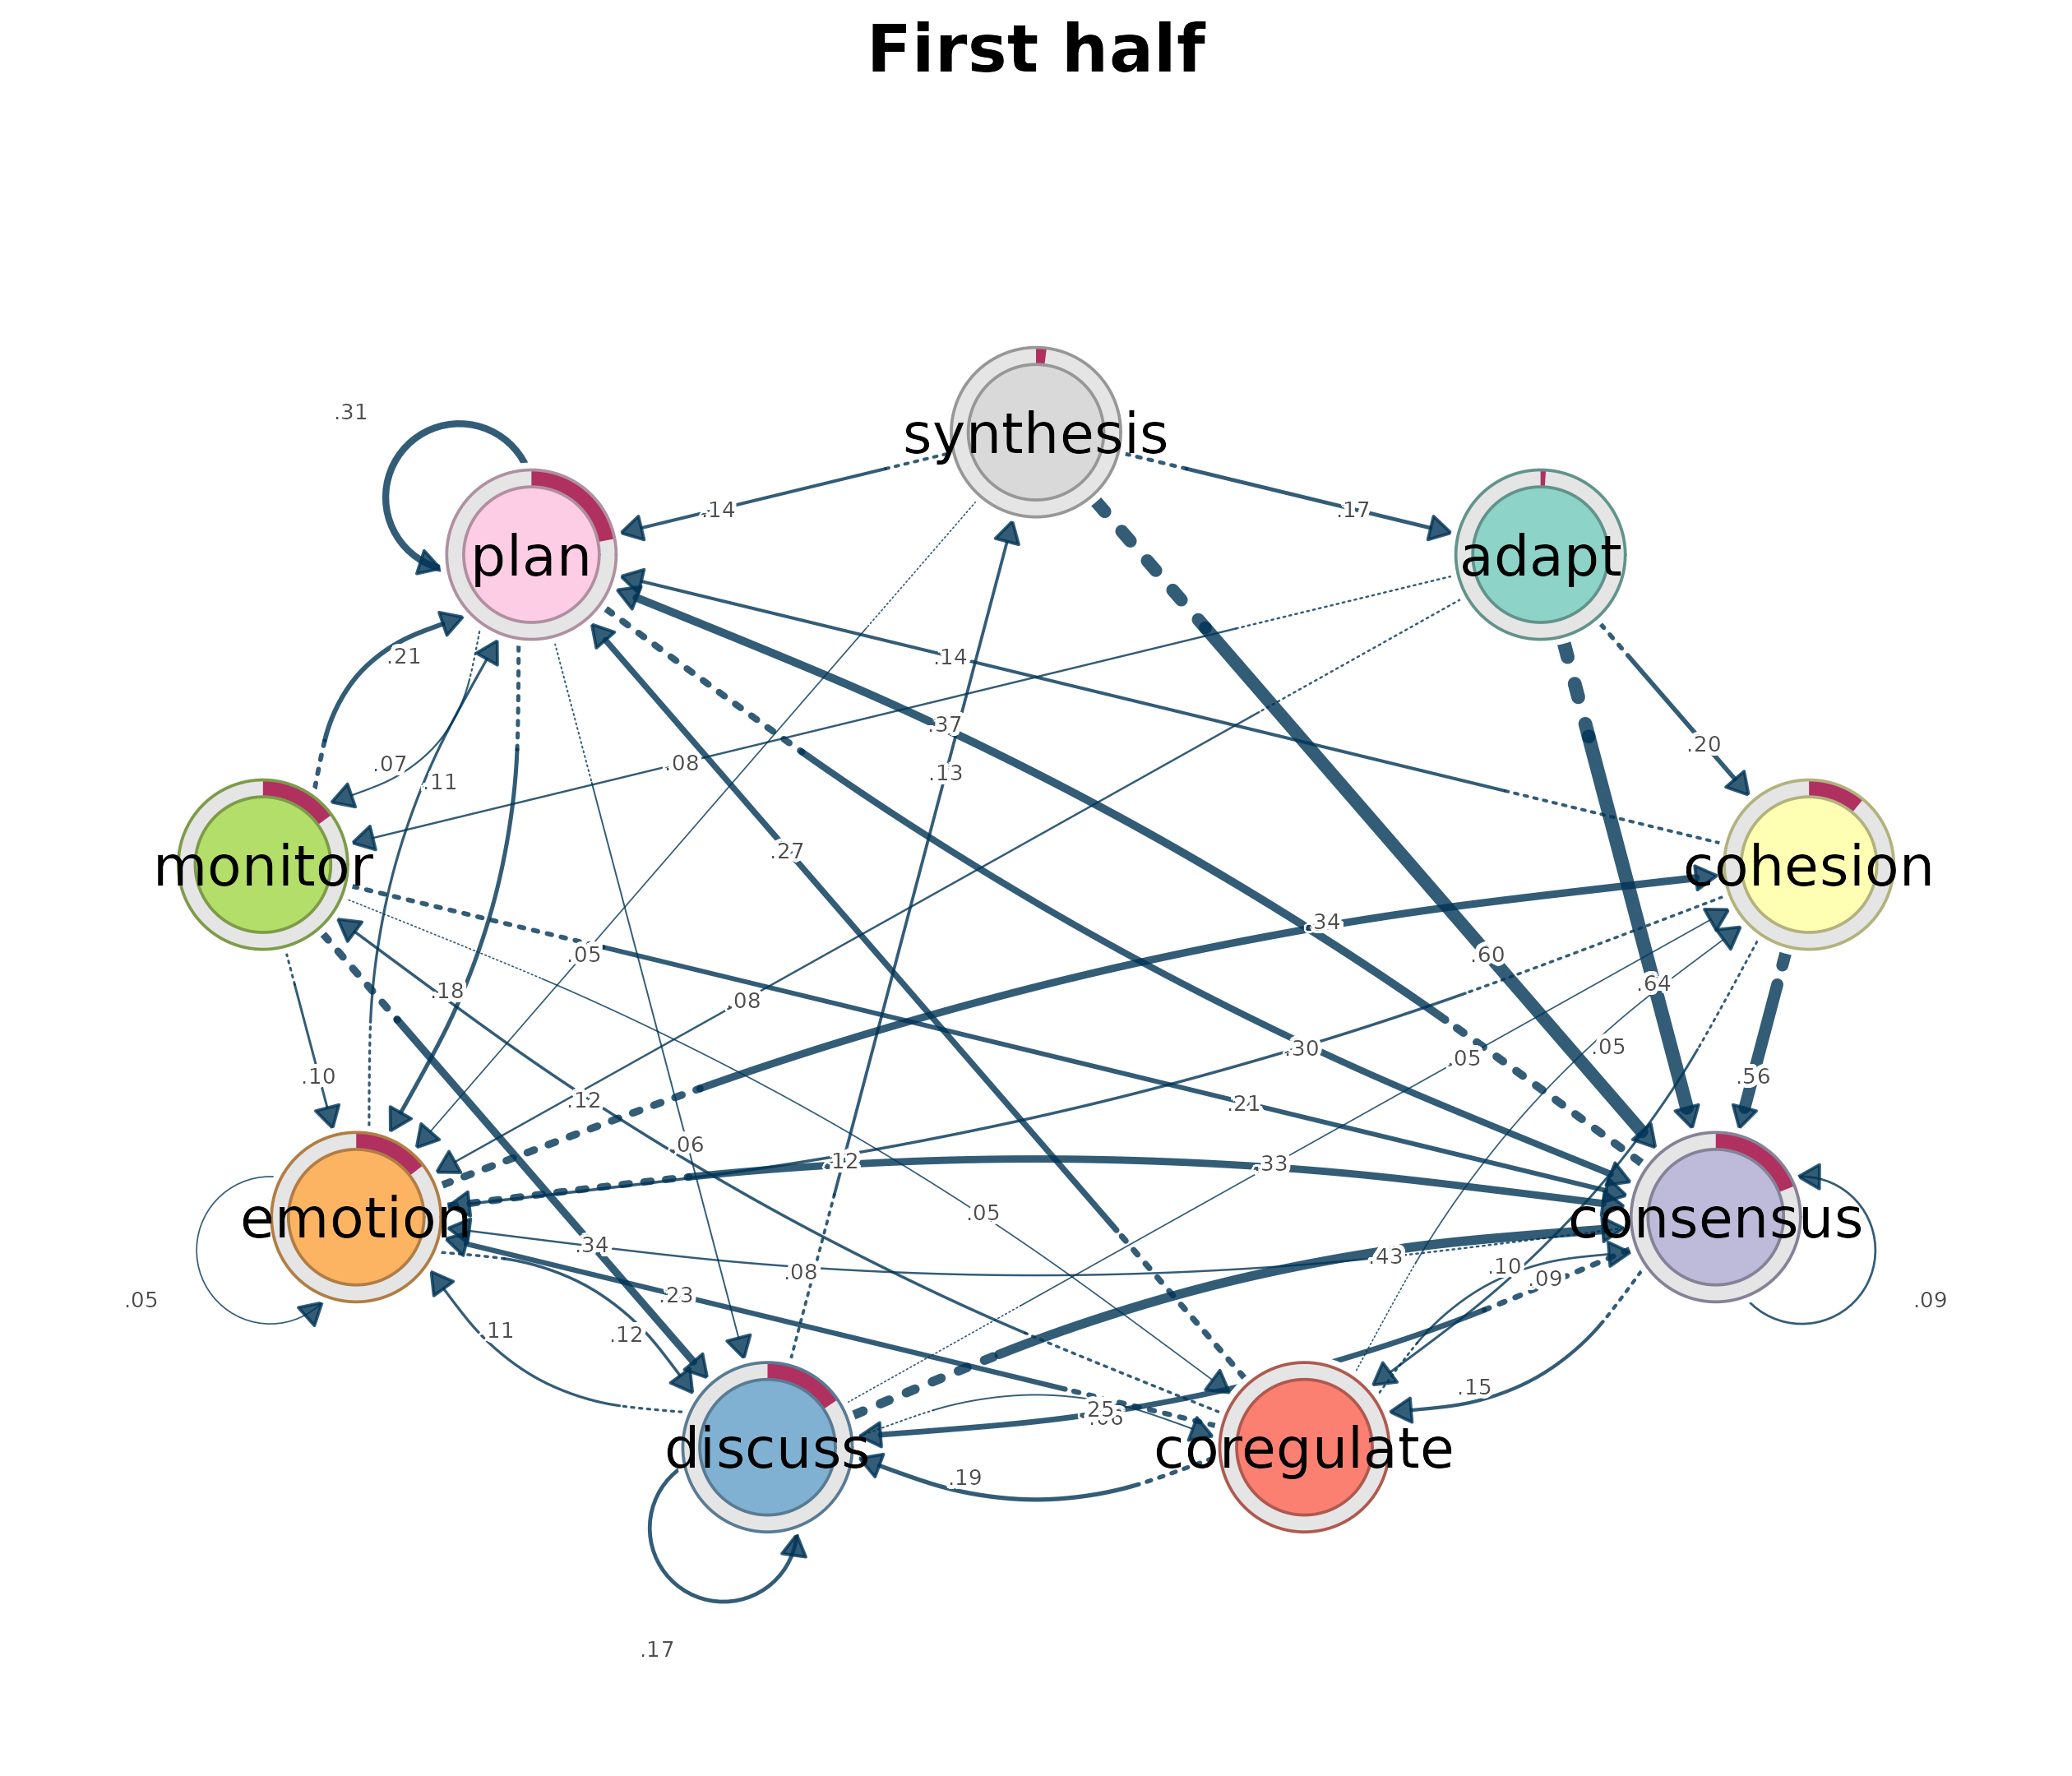
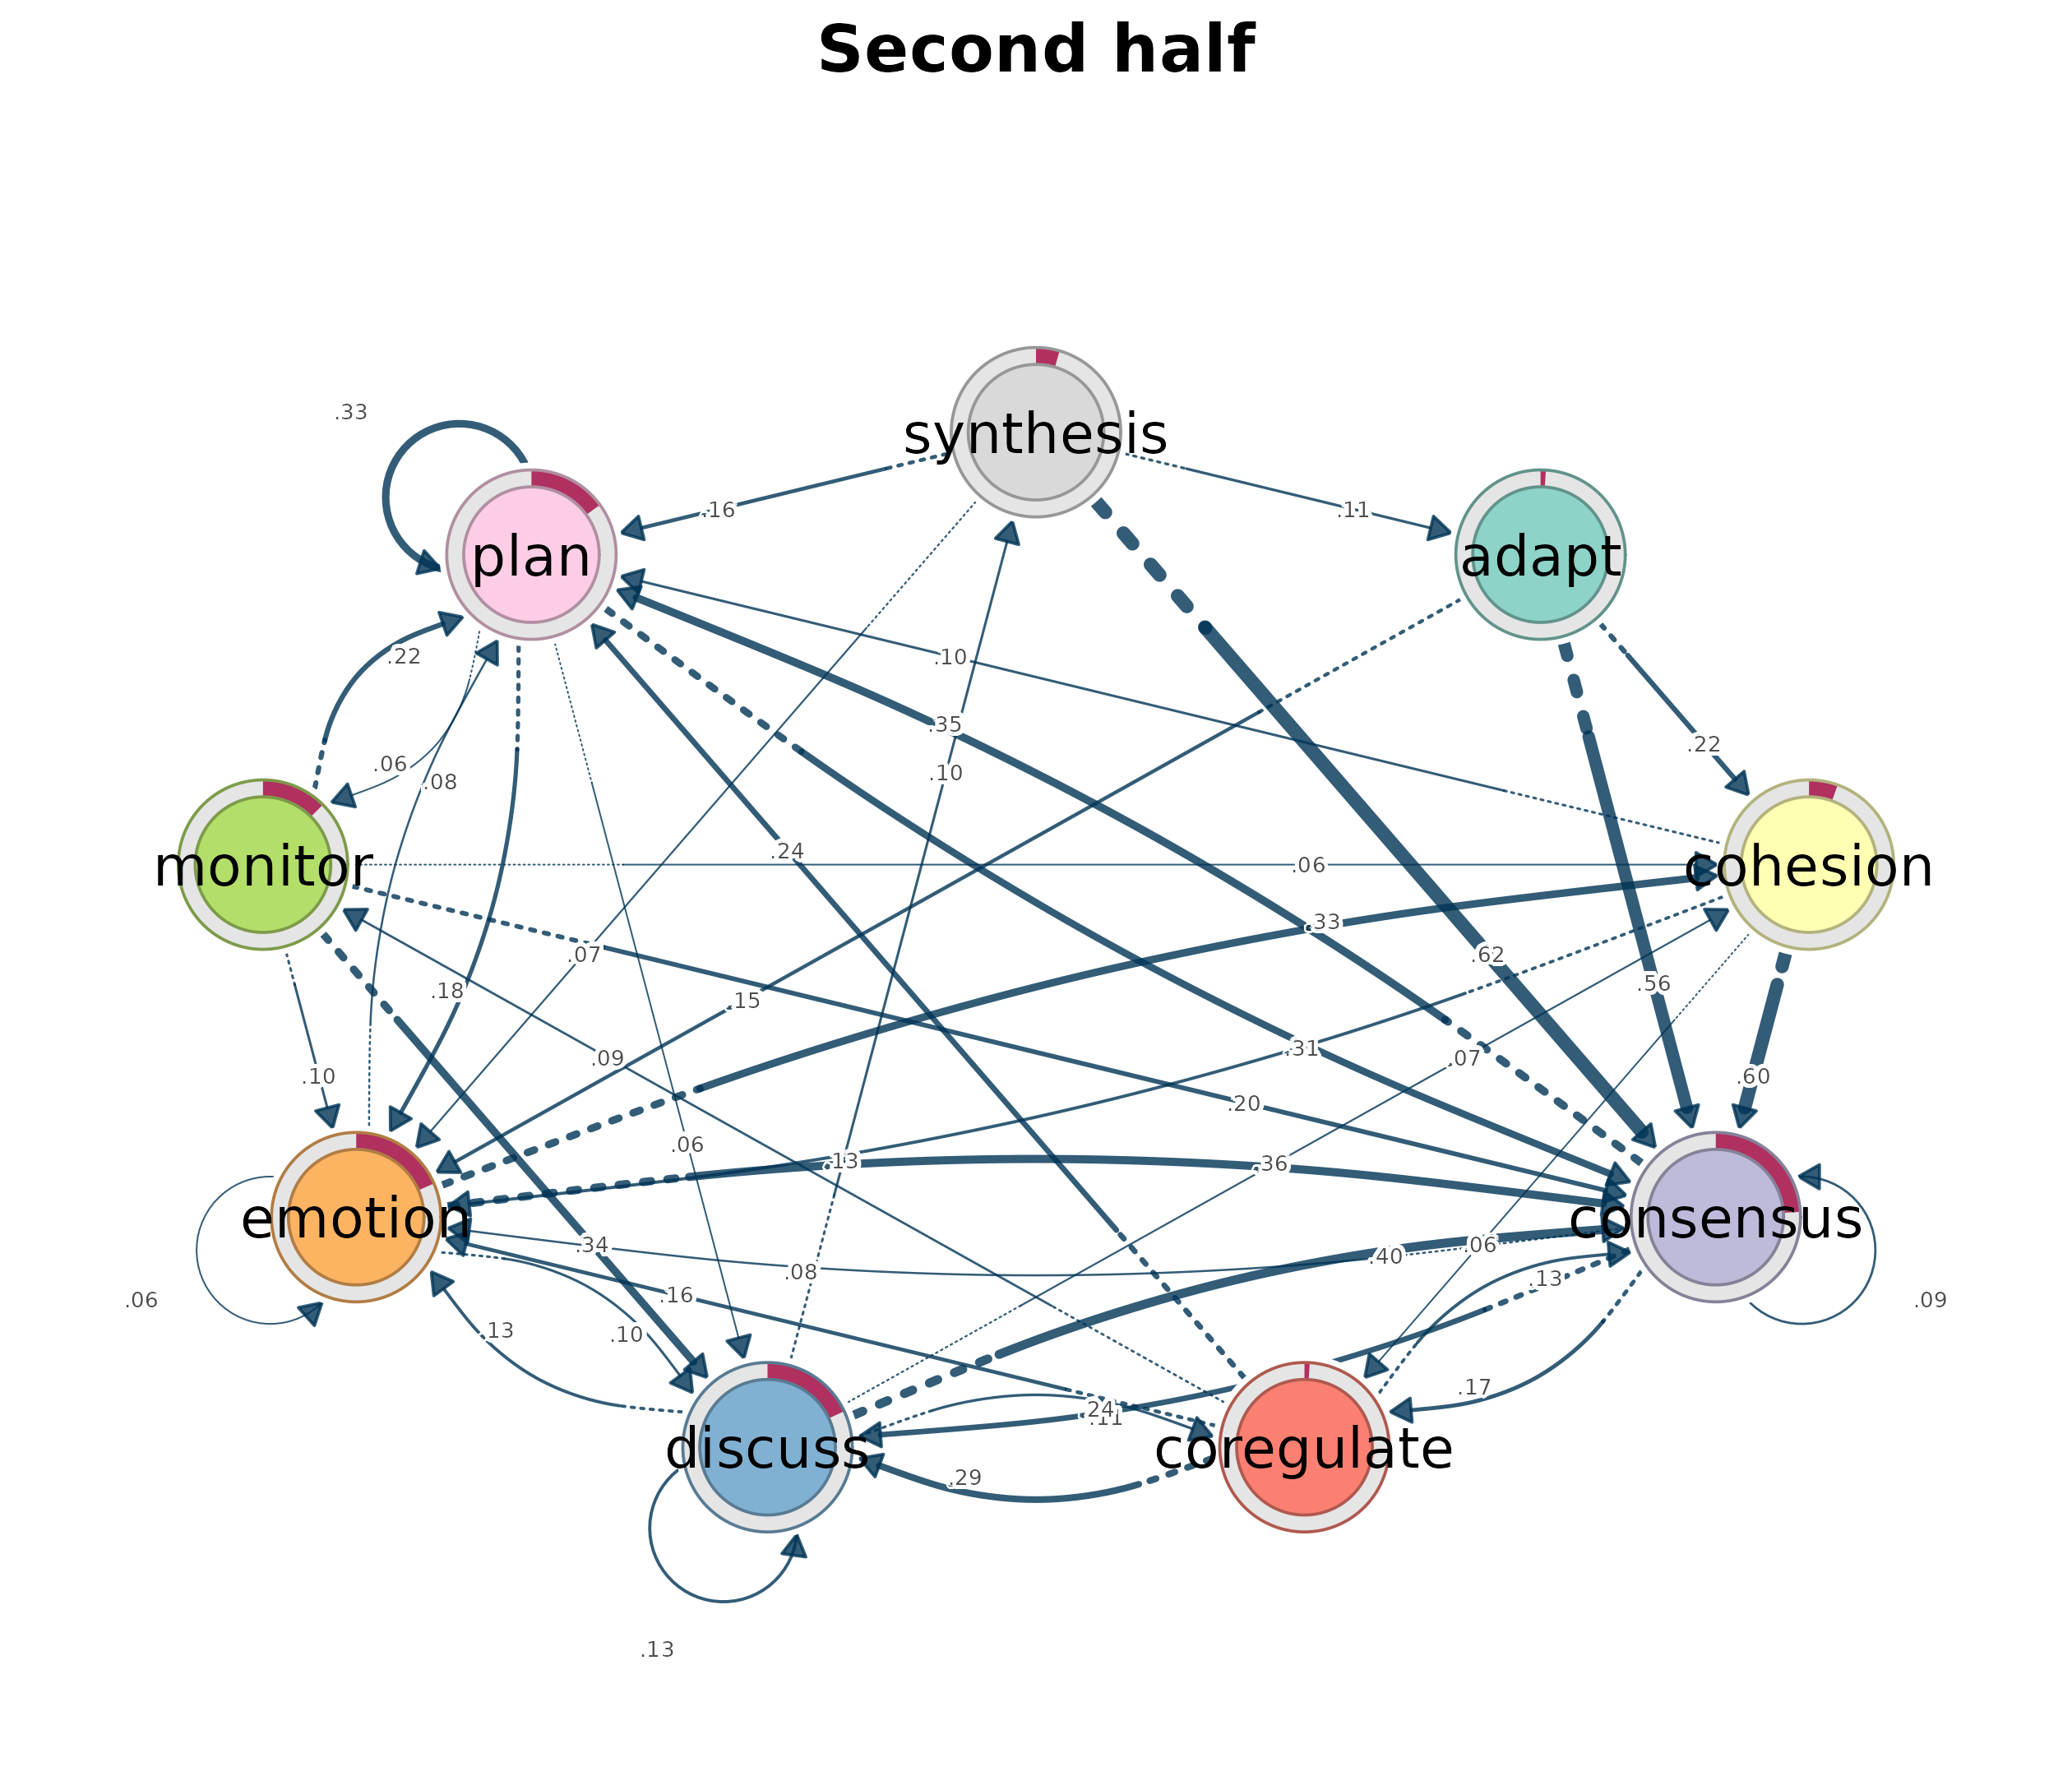
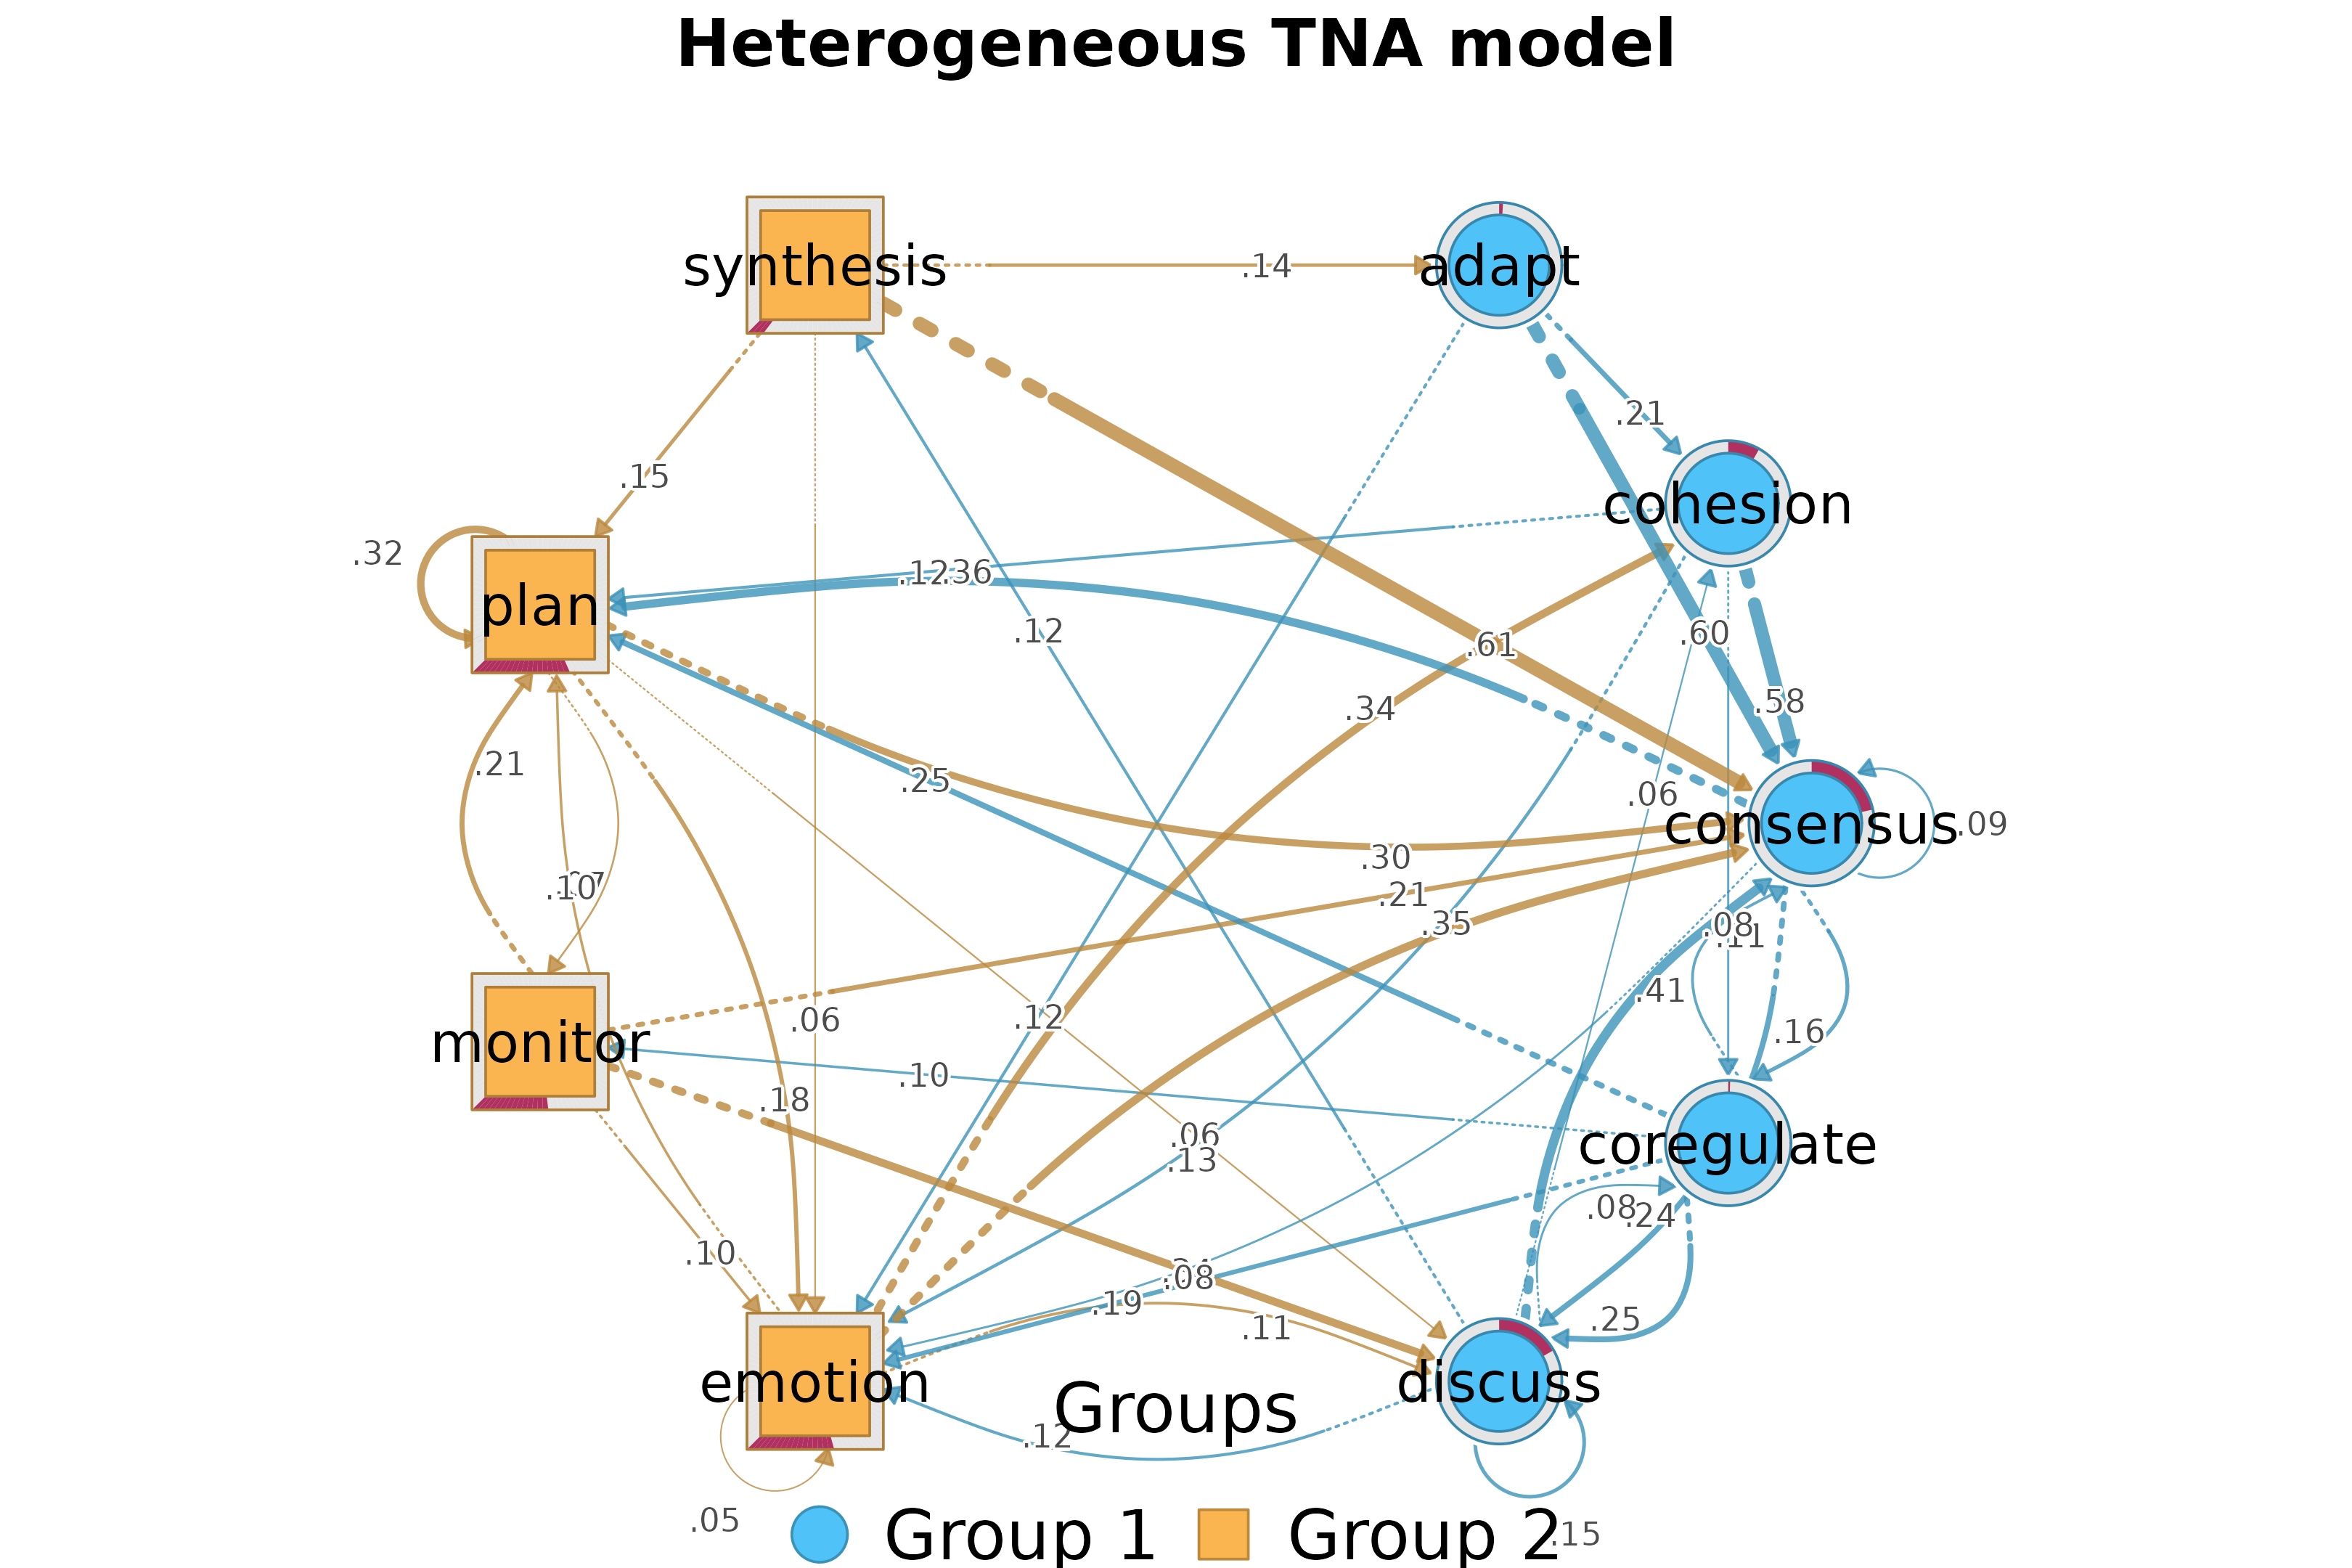
Heterogeneous TNA model
Passing a complete two-part node_list routes
plot.tna() through cograph’s heterogeneous TNA
renderer.
split_at <- ceiling(length(model$labels) / 2)
node_list <- list(
  model$labels[seq_len(split_at)],
  model$labels[seq.int(split_at + 1, length(model$labels))]
)
plot(
  model,
  node_list = node_list,
  title = "Heterogeneous TNA model",
  minimum = 0.05
)
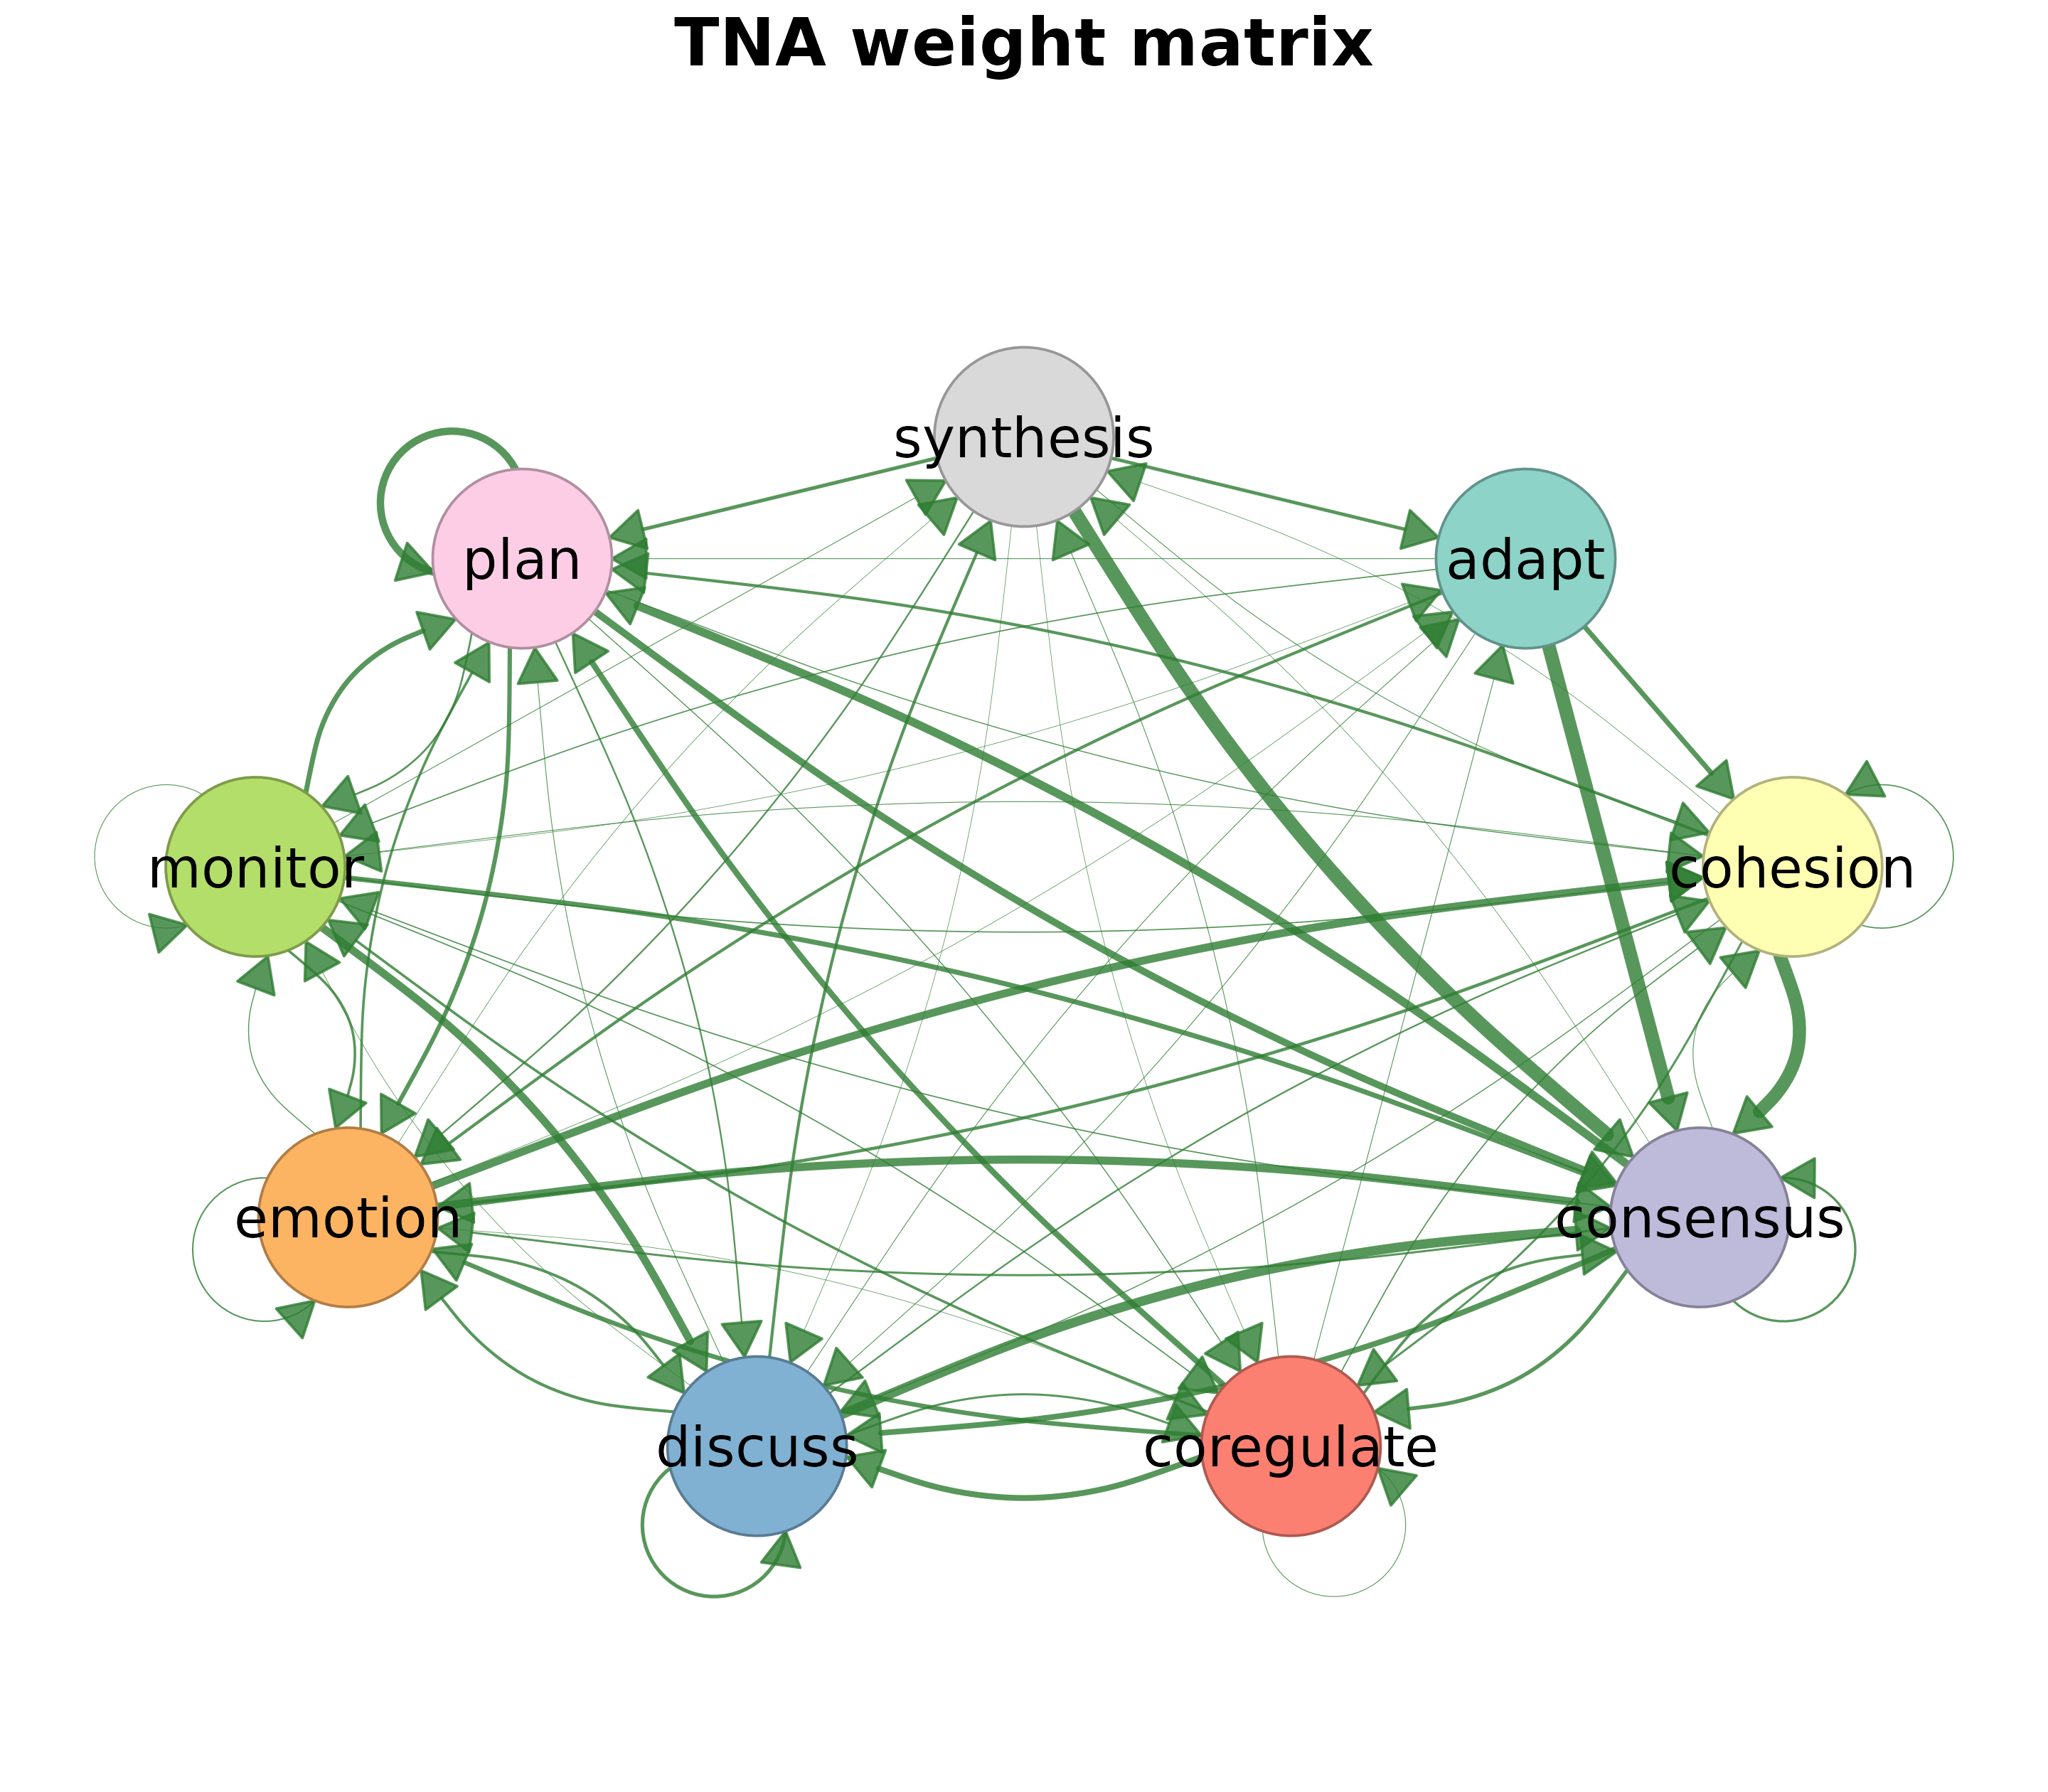
Weight matrix
Exercises the exported plot_model() entry point.
tna::plot_model(
  model$weights,
  labels = model$labels,
  title = "TNA weight matrix"
)
Edge and state distributions
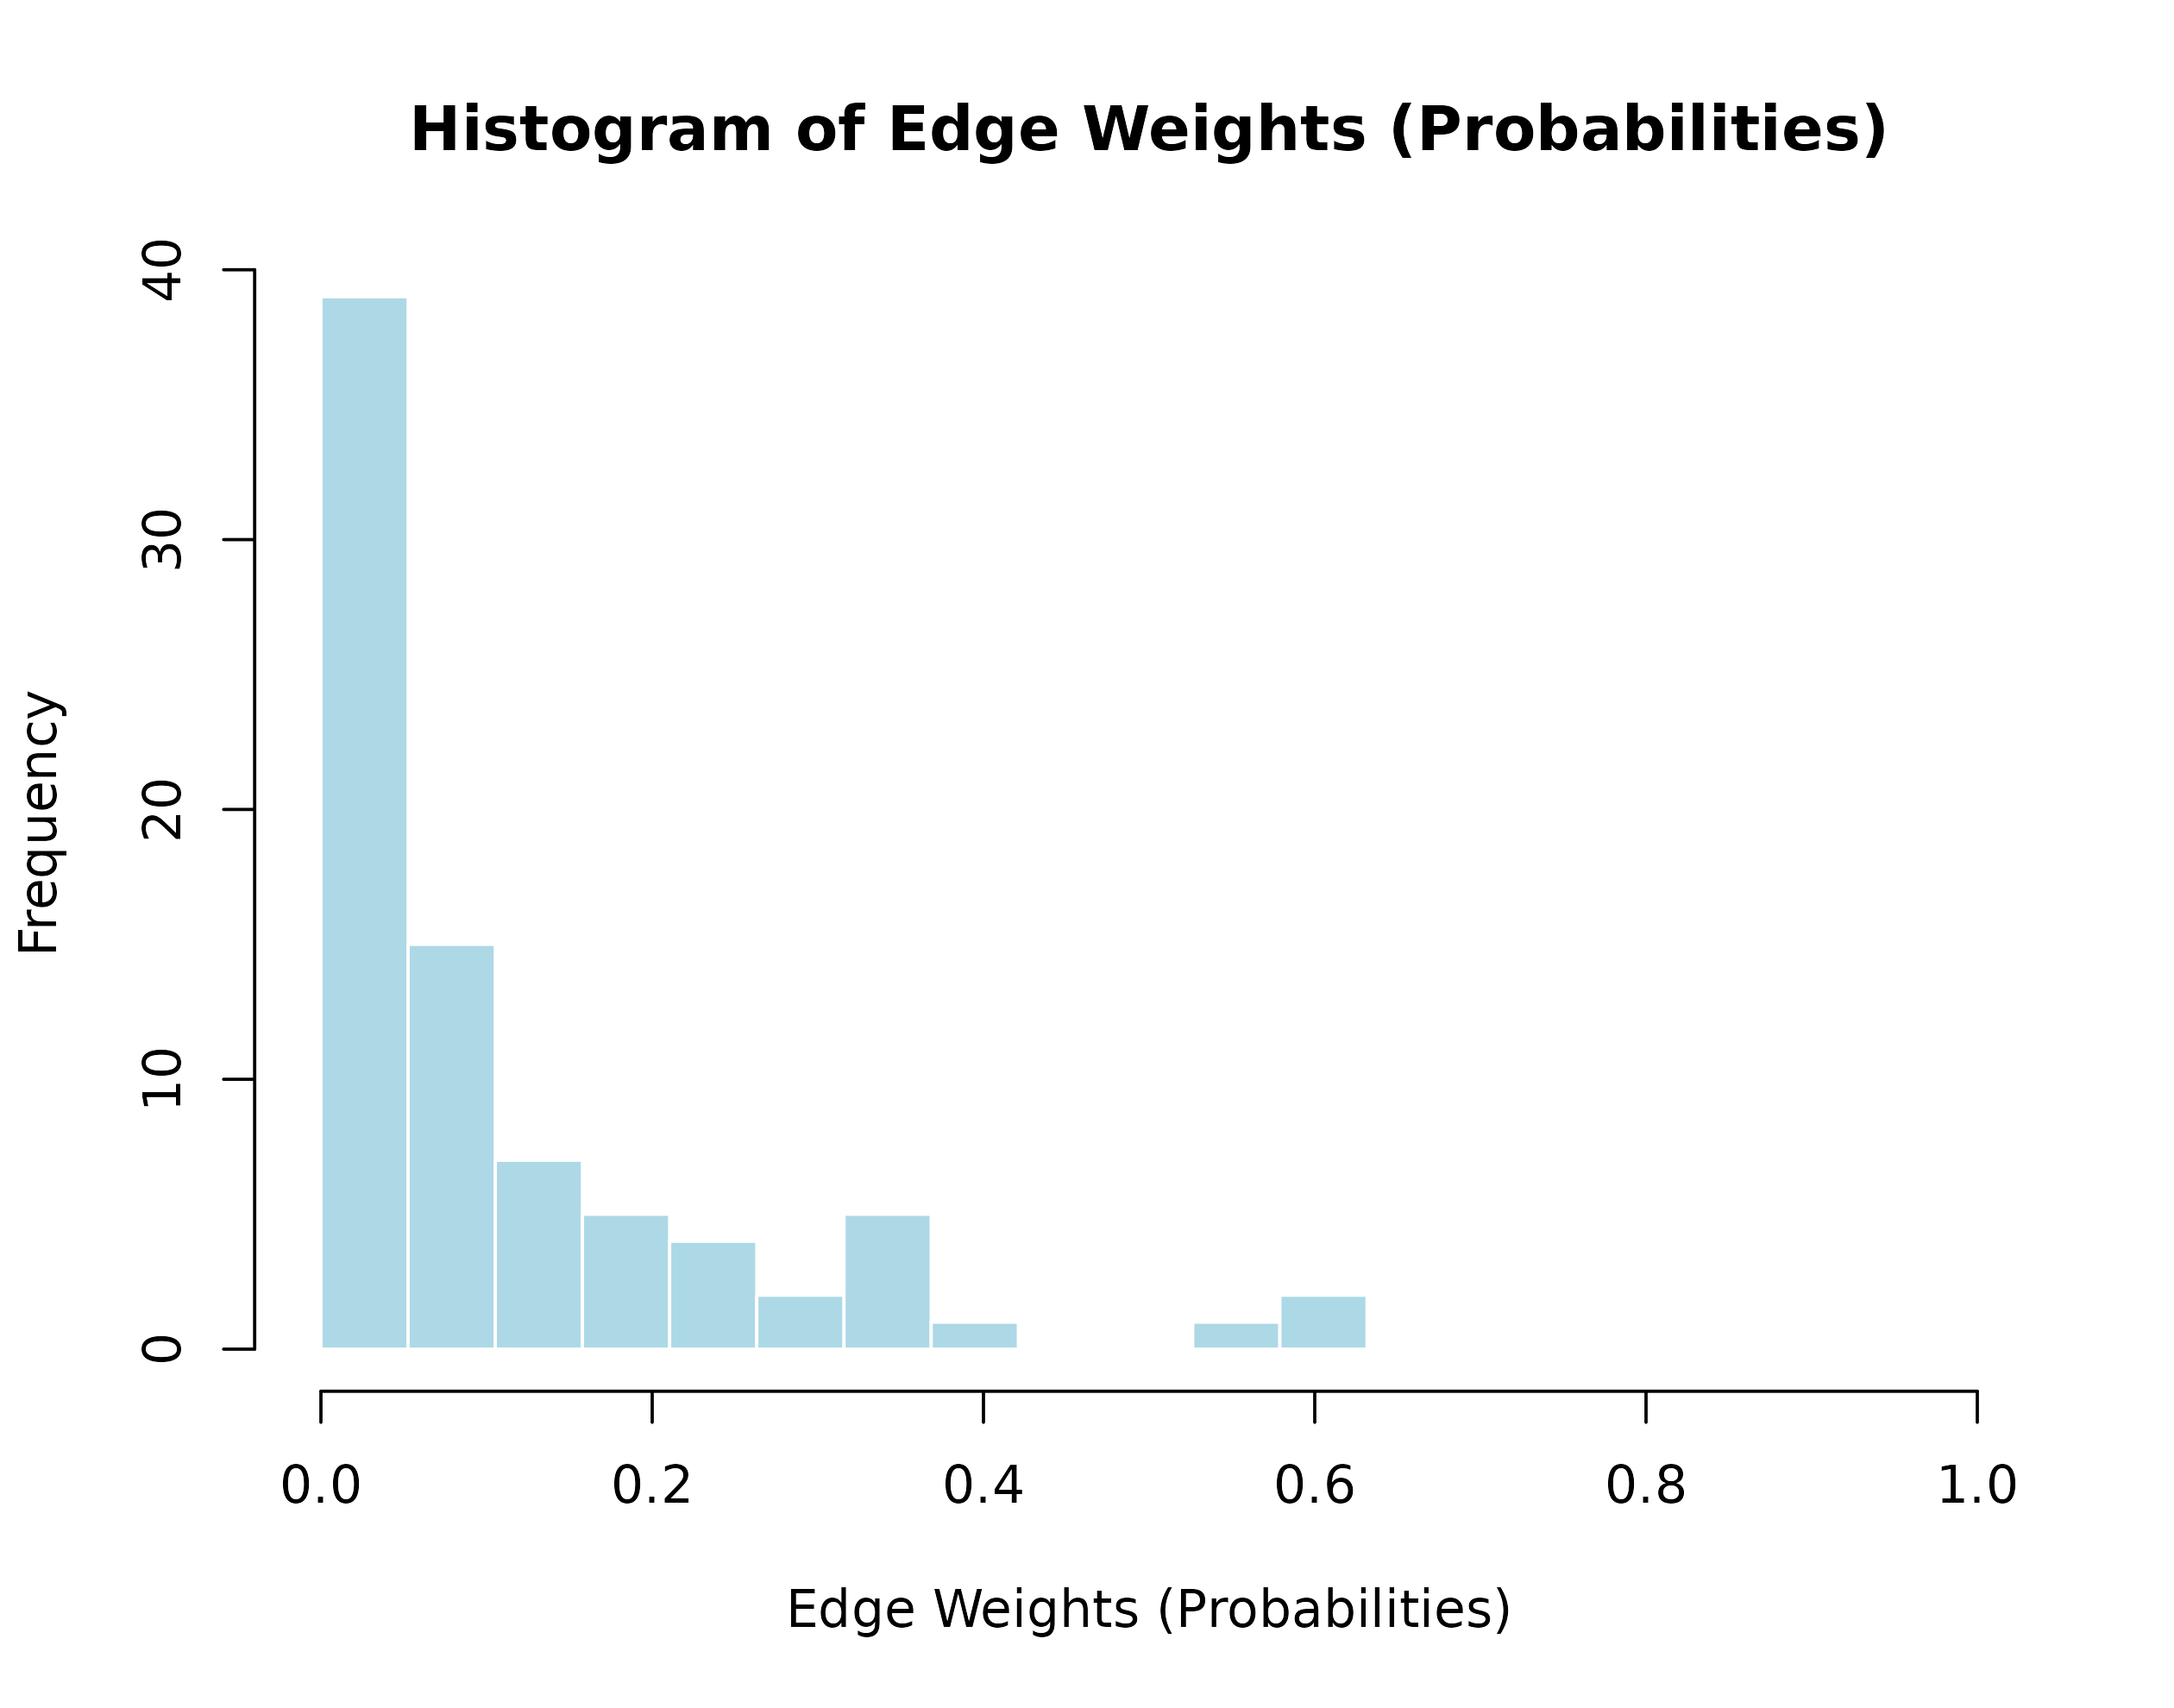
Edge-weight histograms
Exercises both hist.tna() and
hist.group_tna().
hist(model, main = "Single-model edge weights")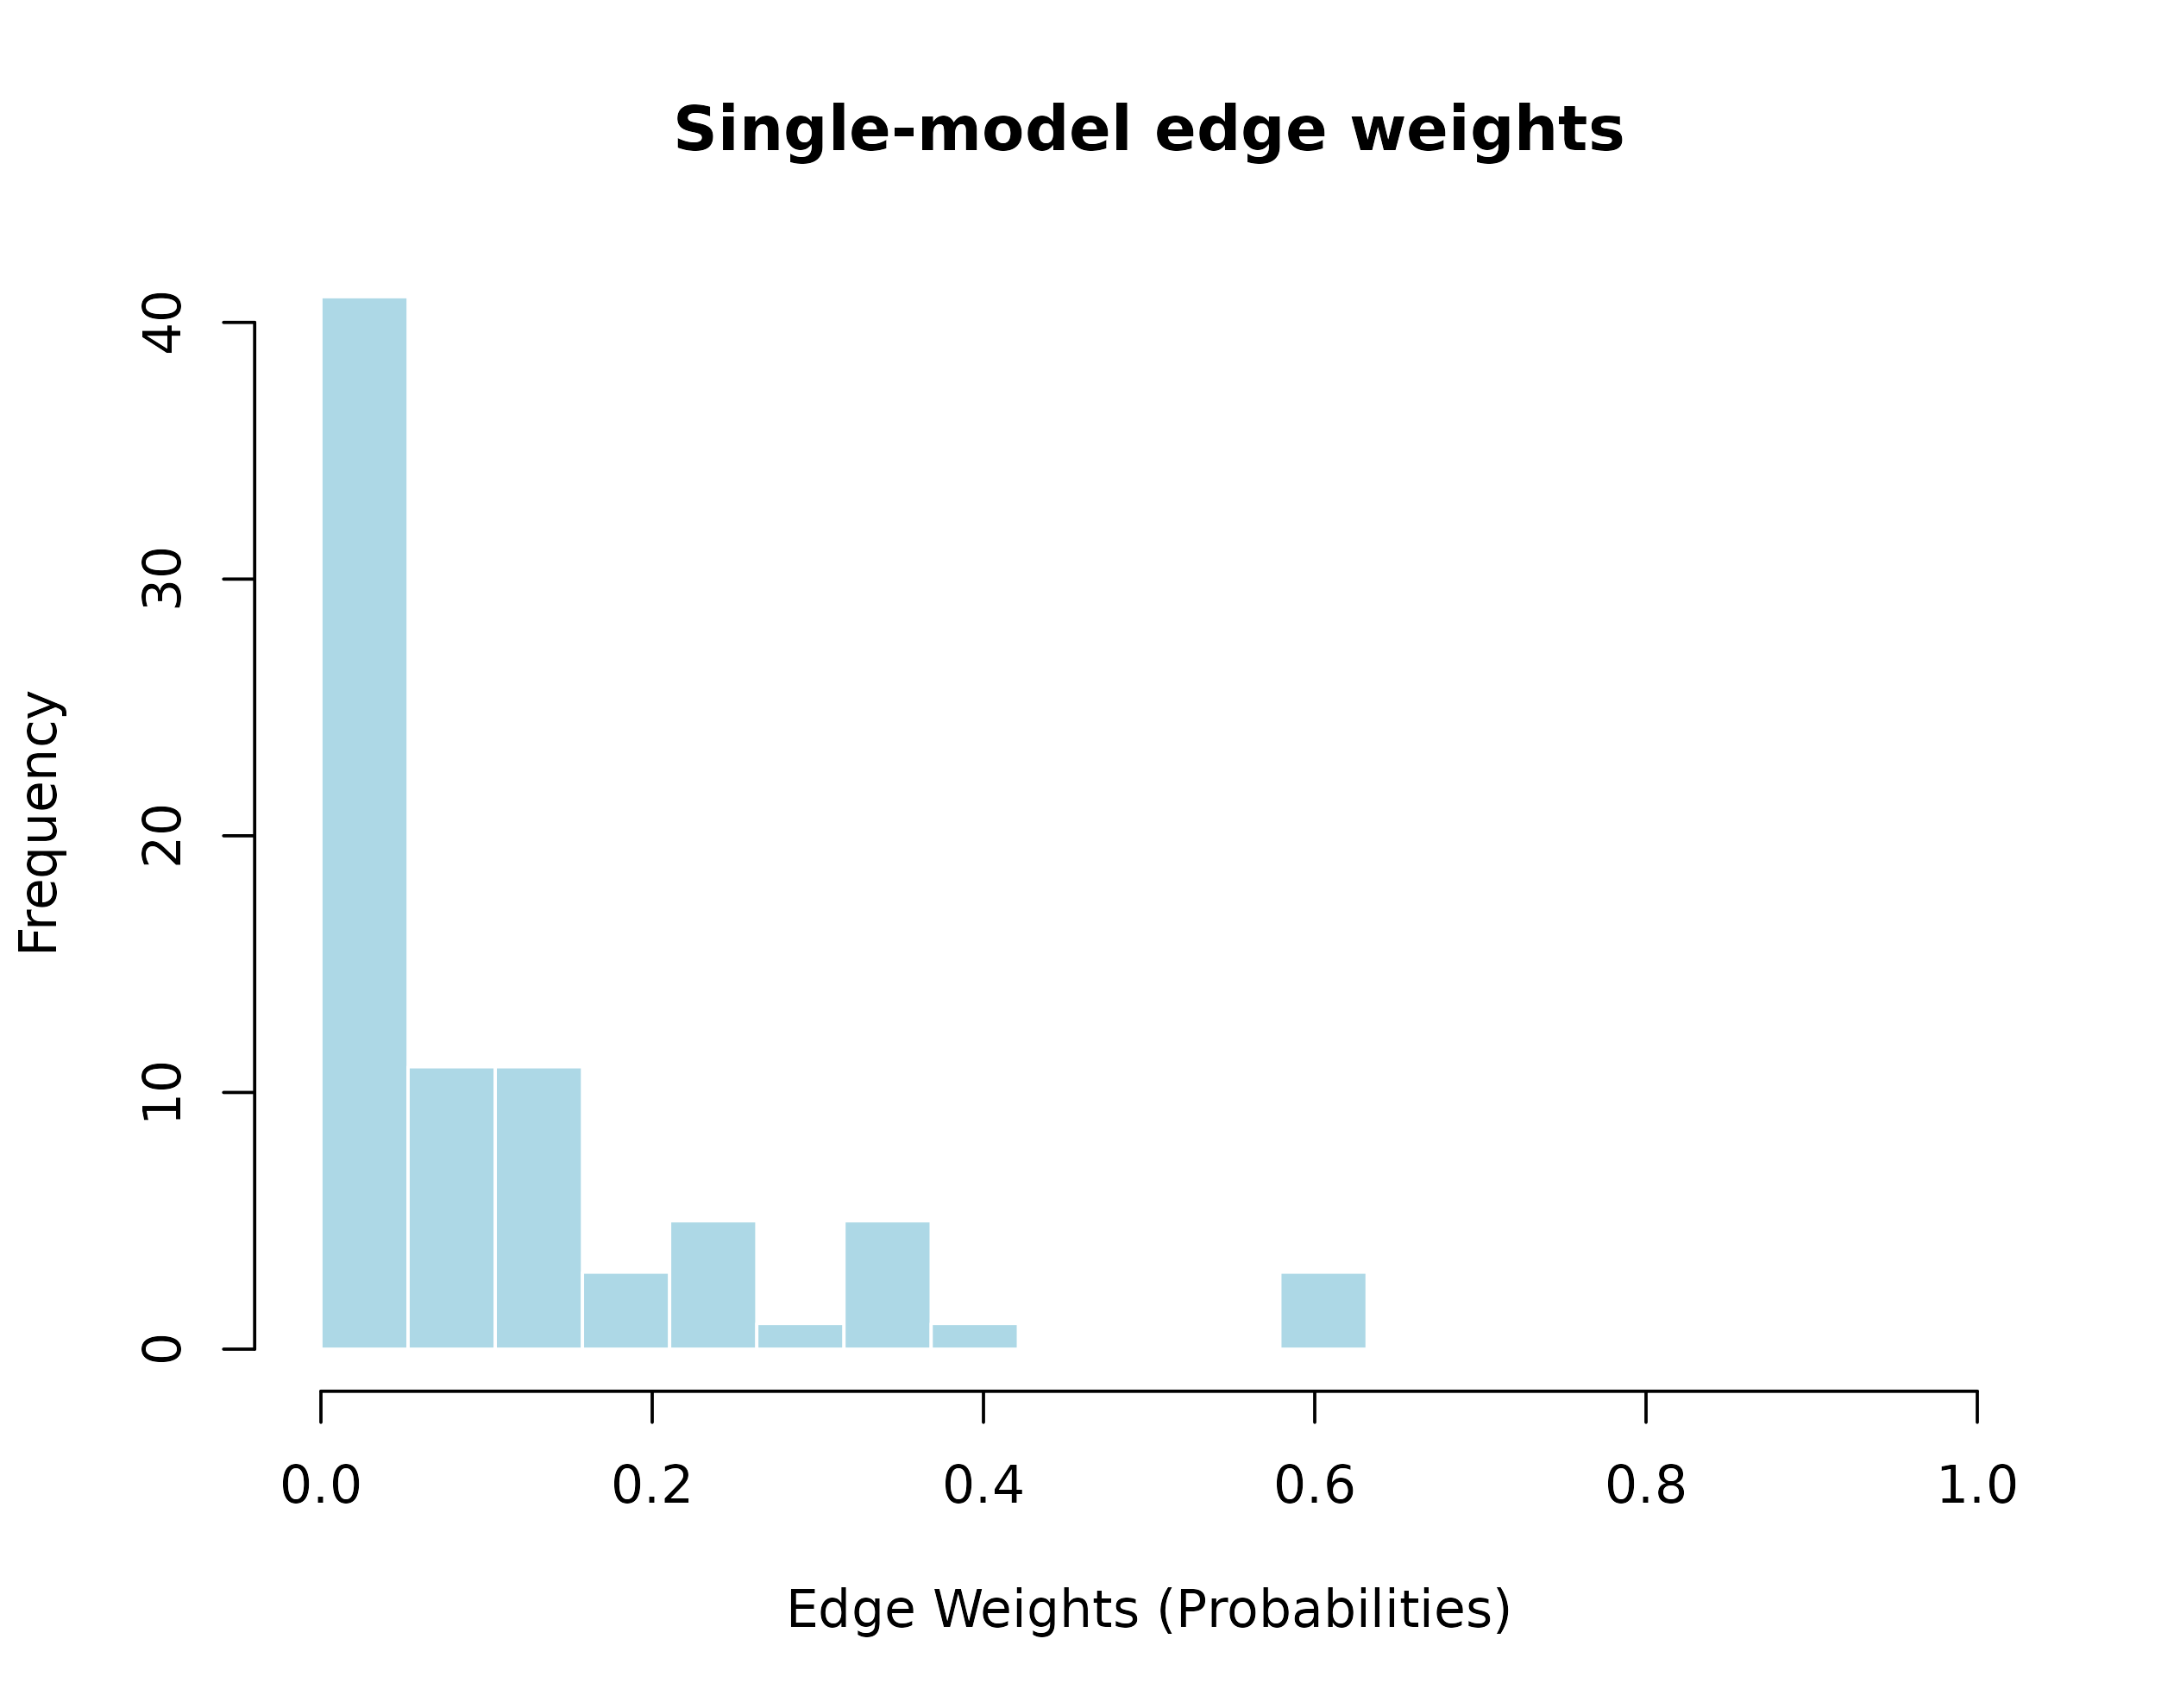
hist(group_models)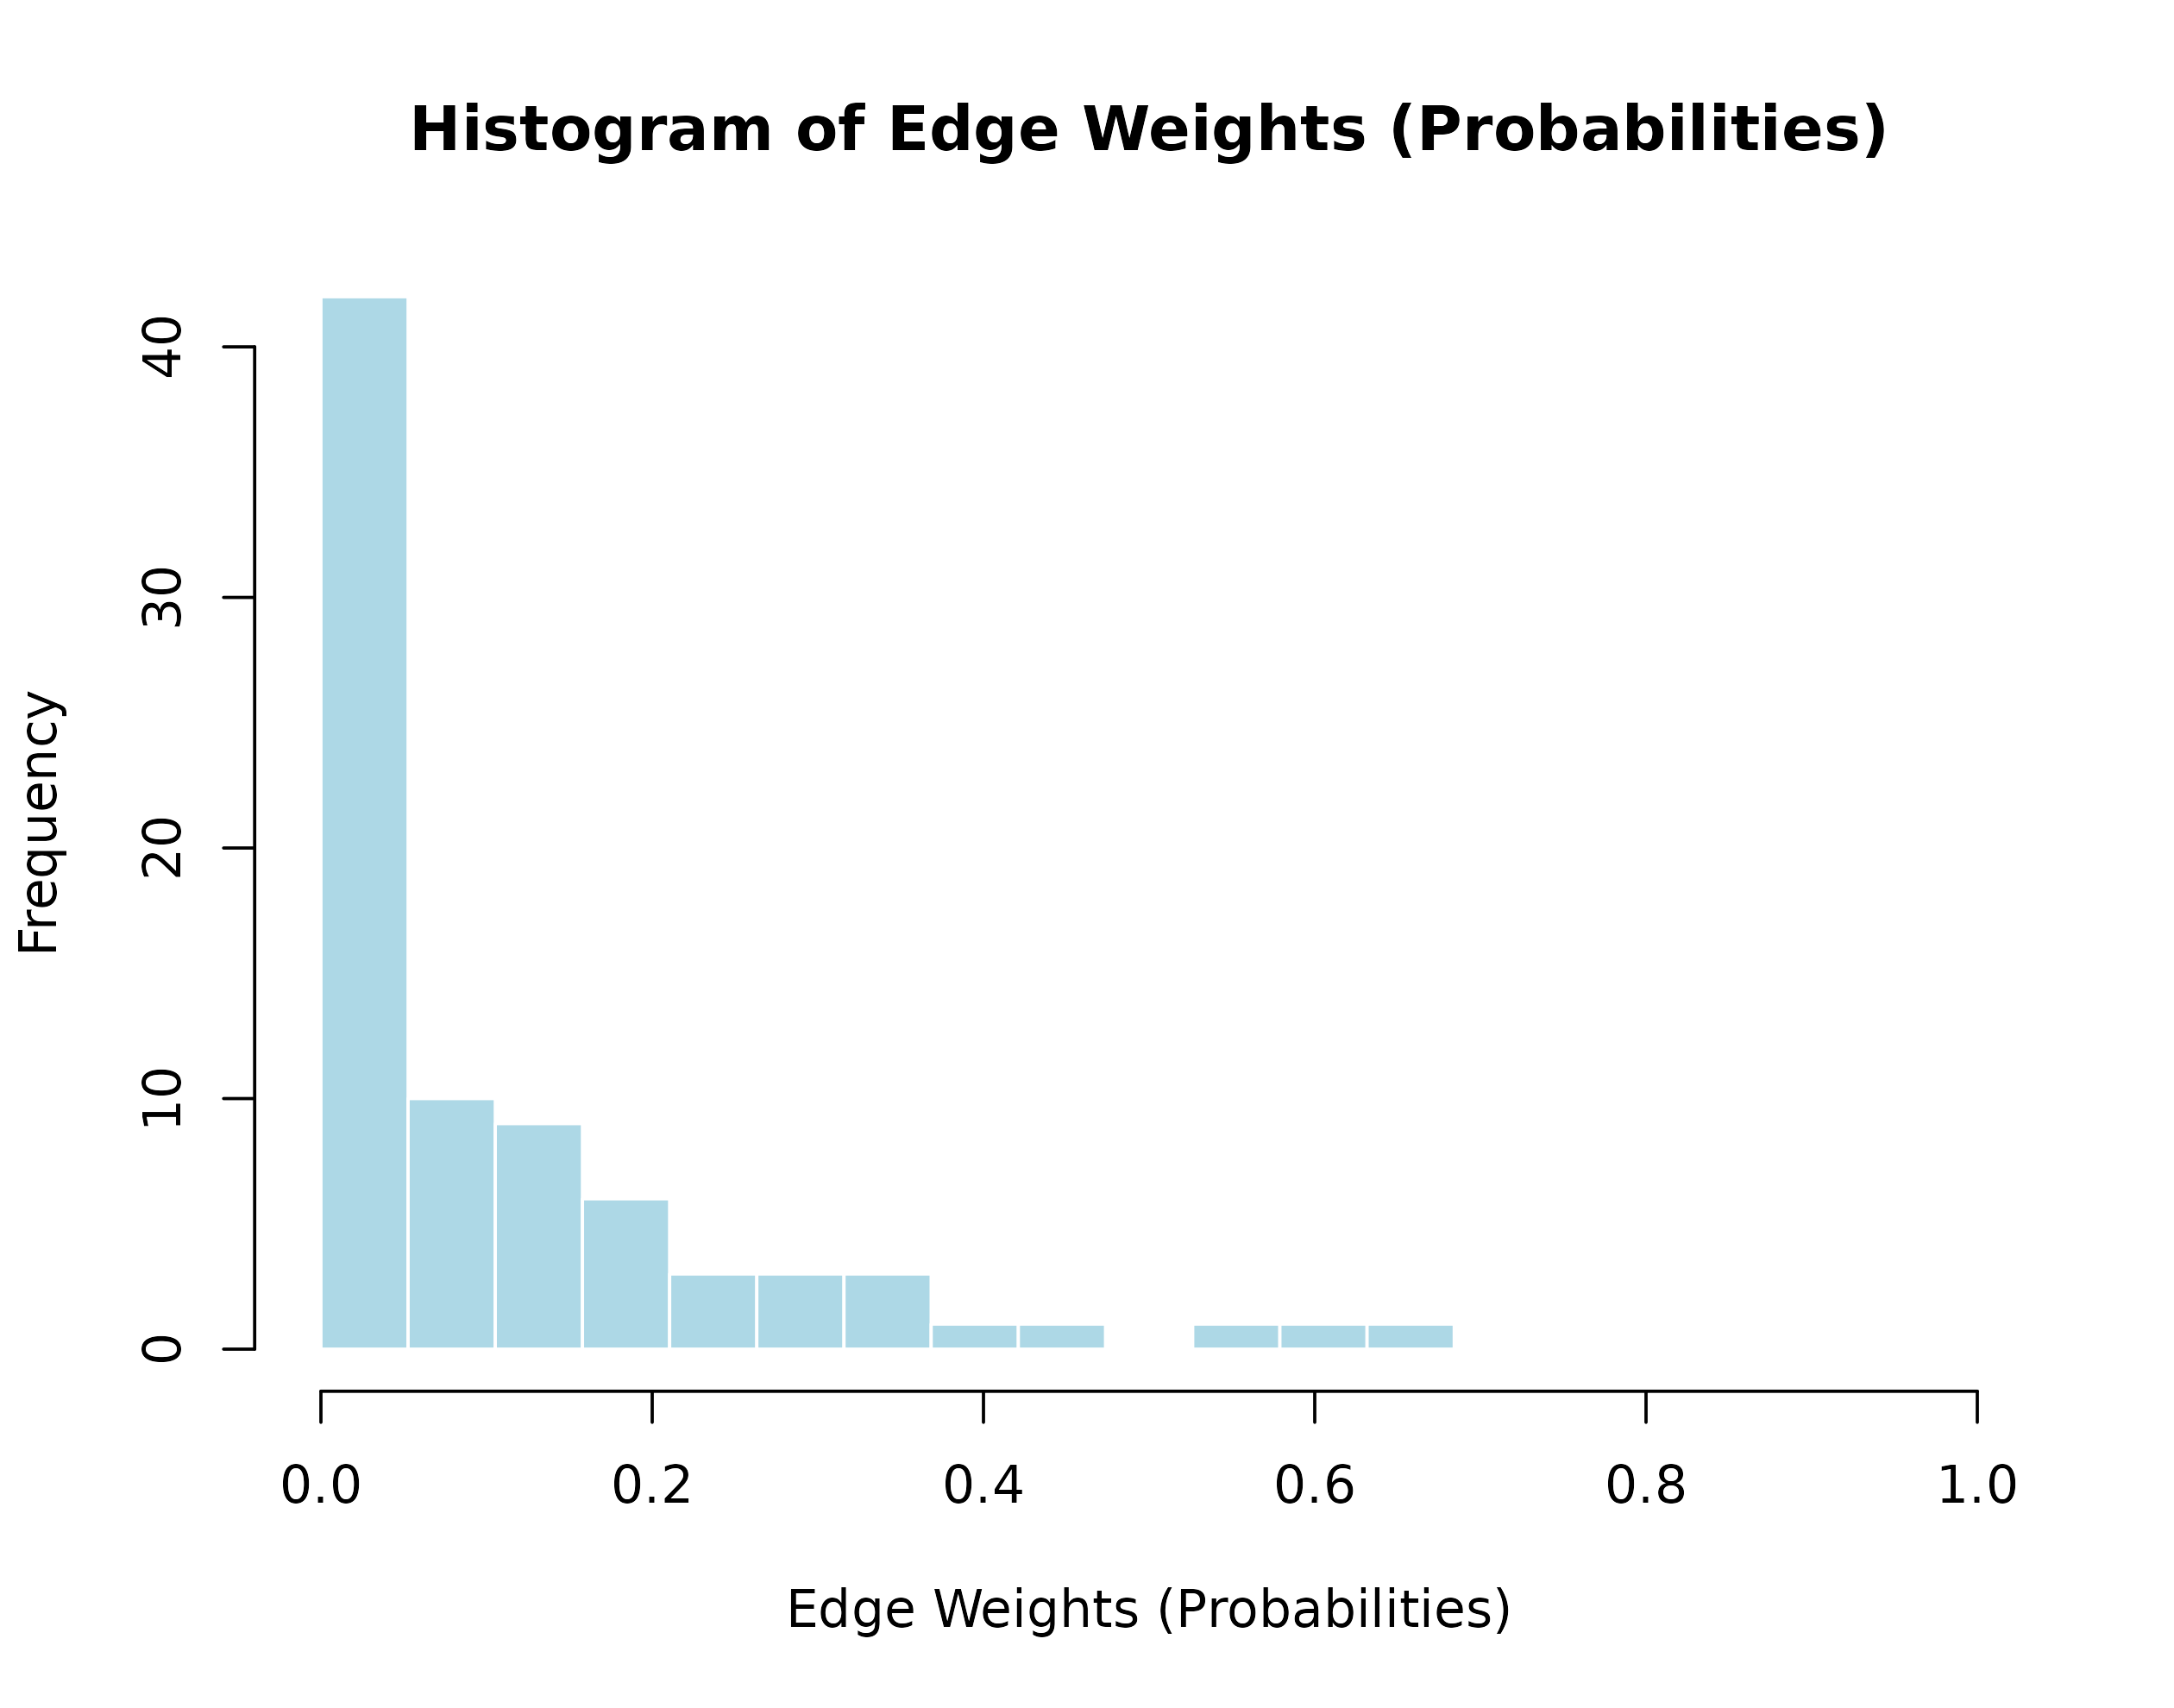
State frequencies
Exercises plot_frequencies.tna() and
plot_frequencies.group_tna().
tna::plot_frequencies(model)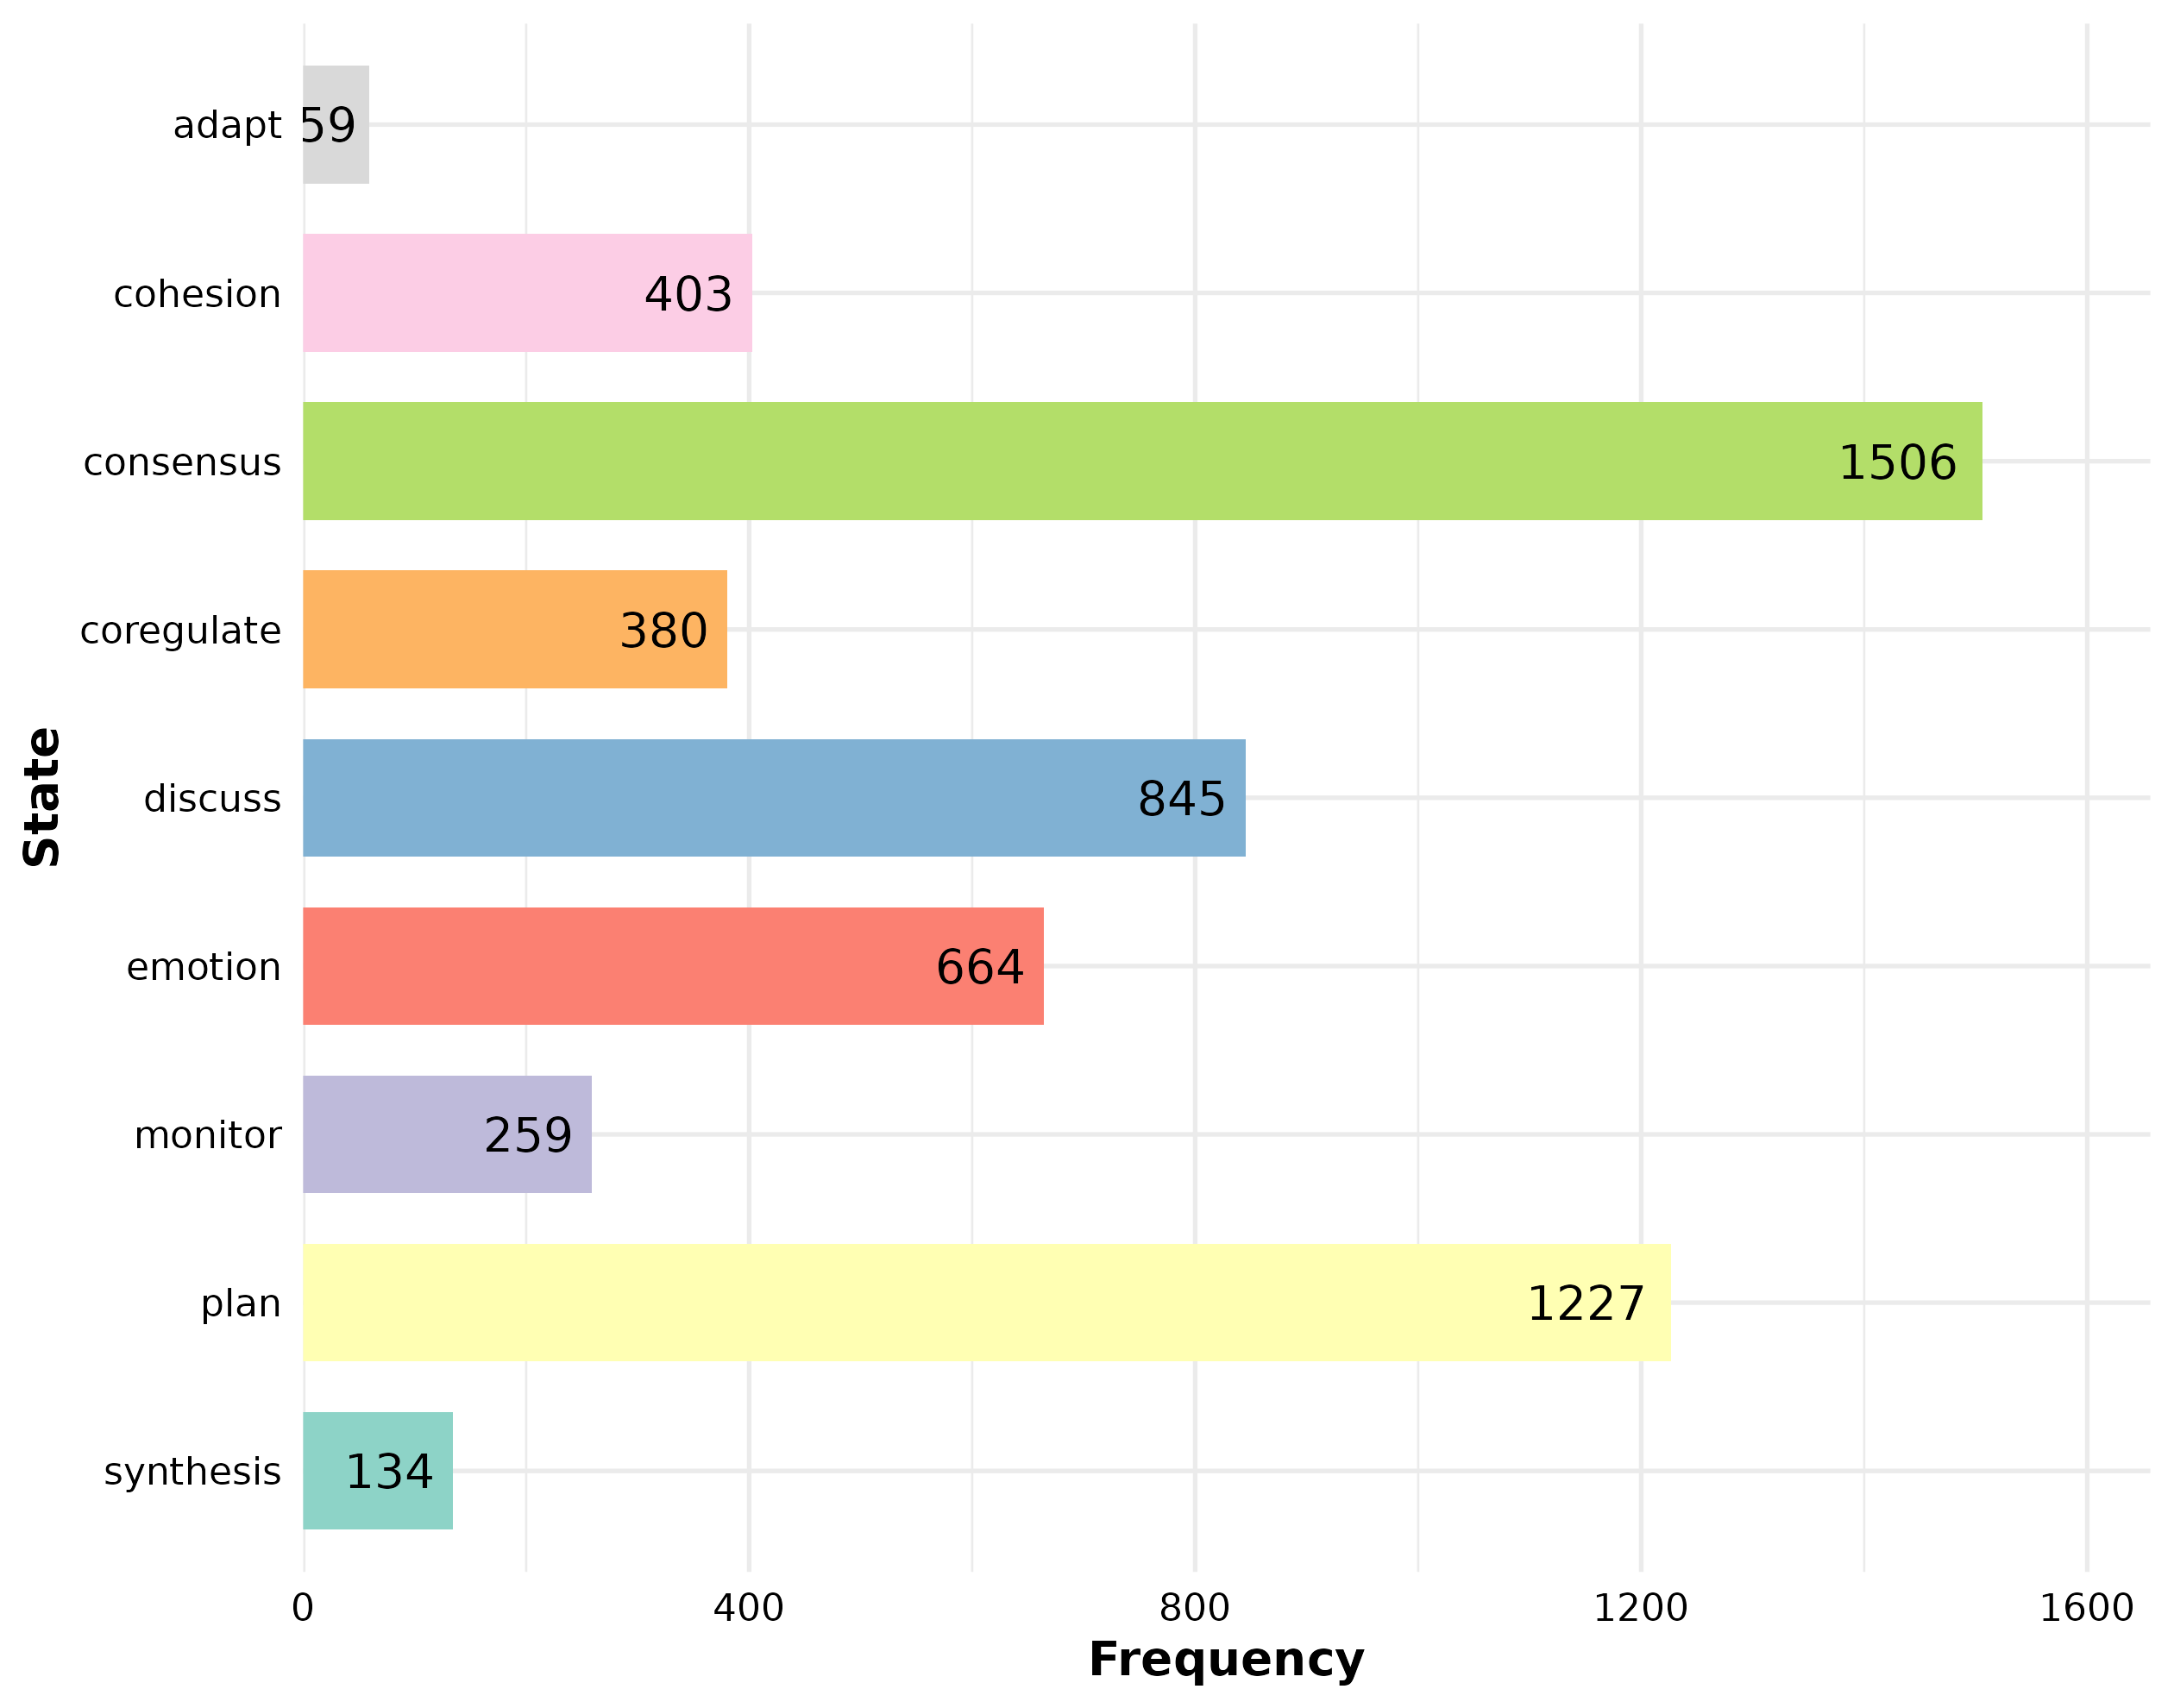
tna::plot_frequencies(group_models)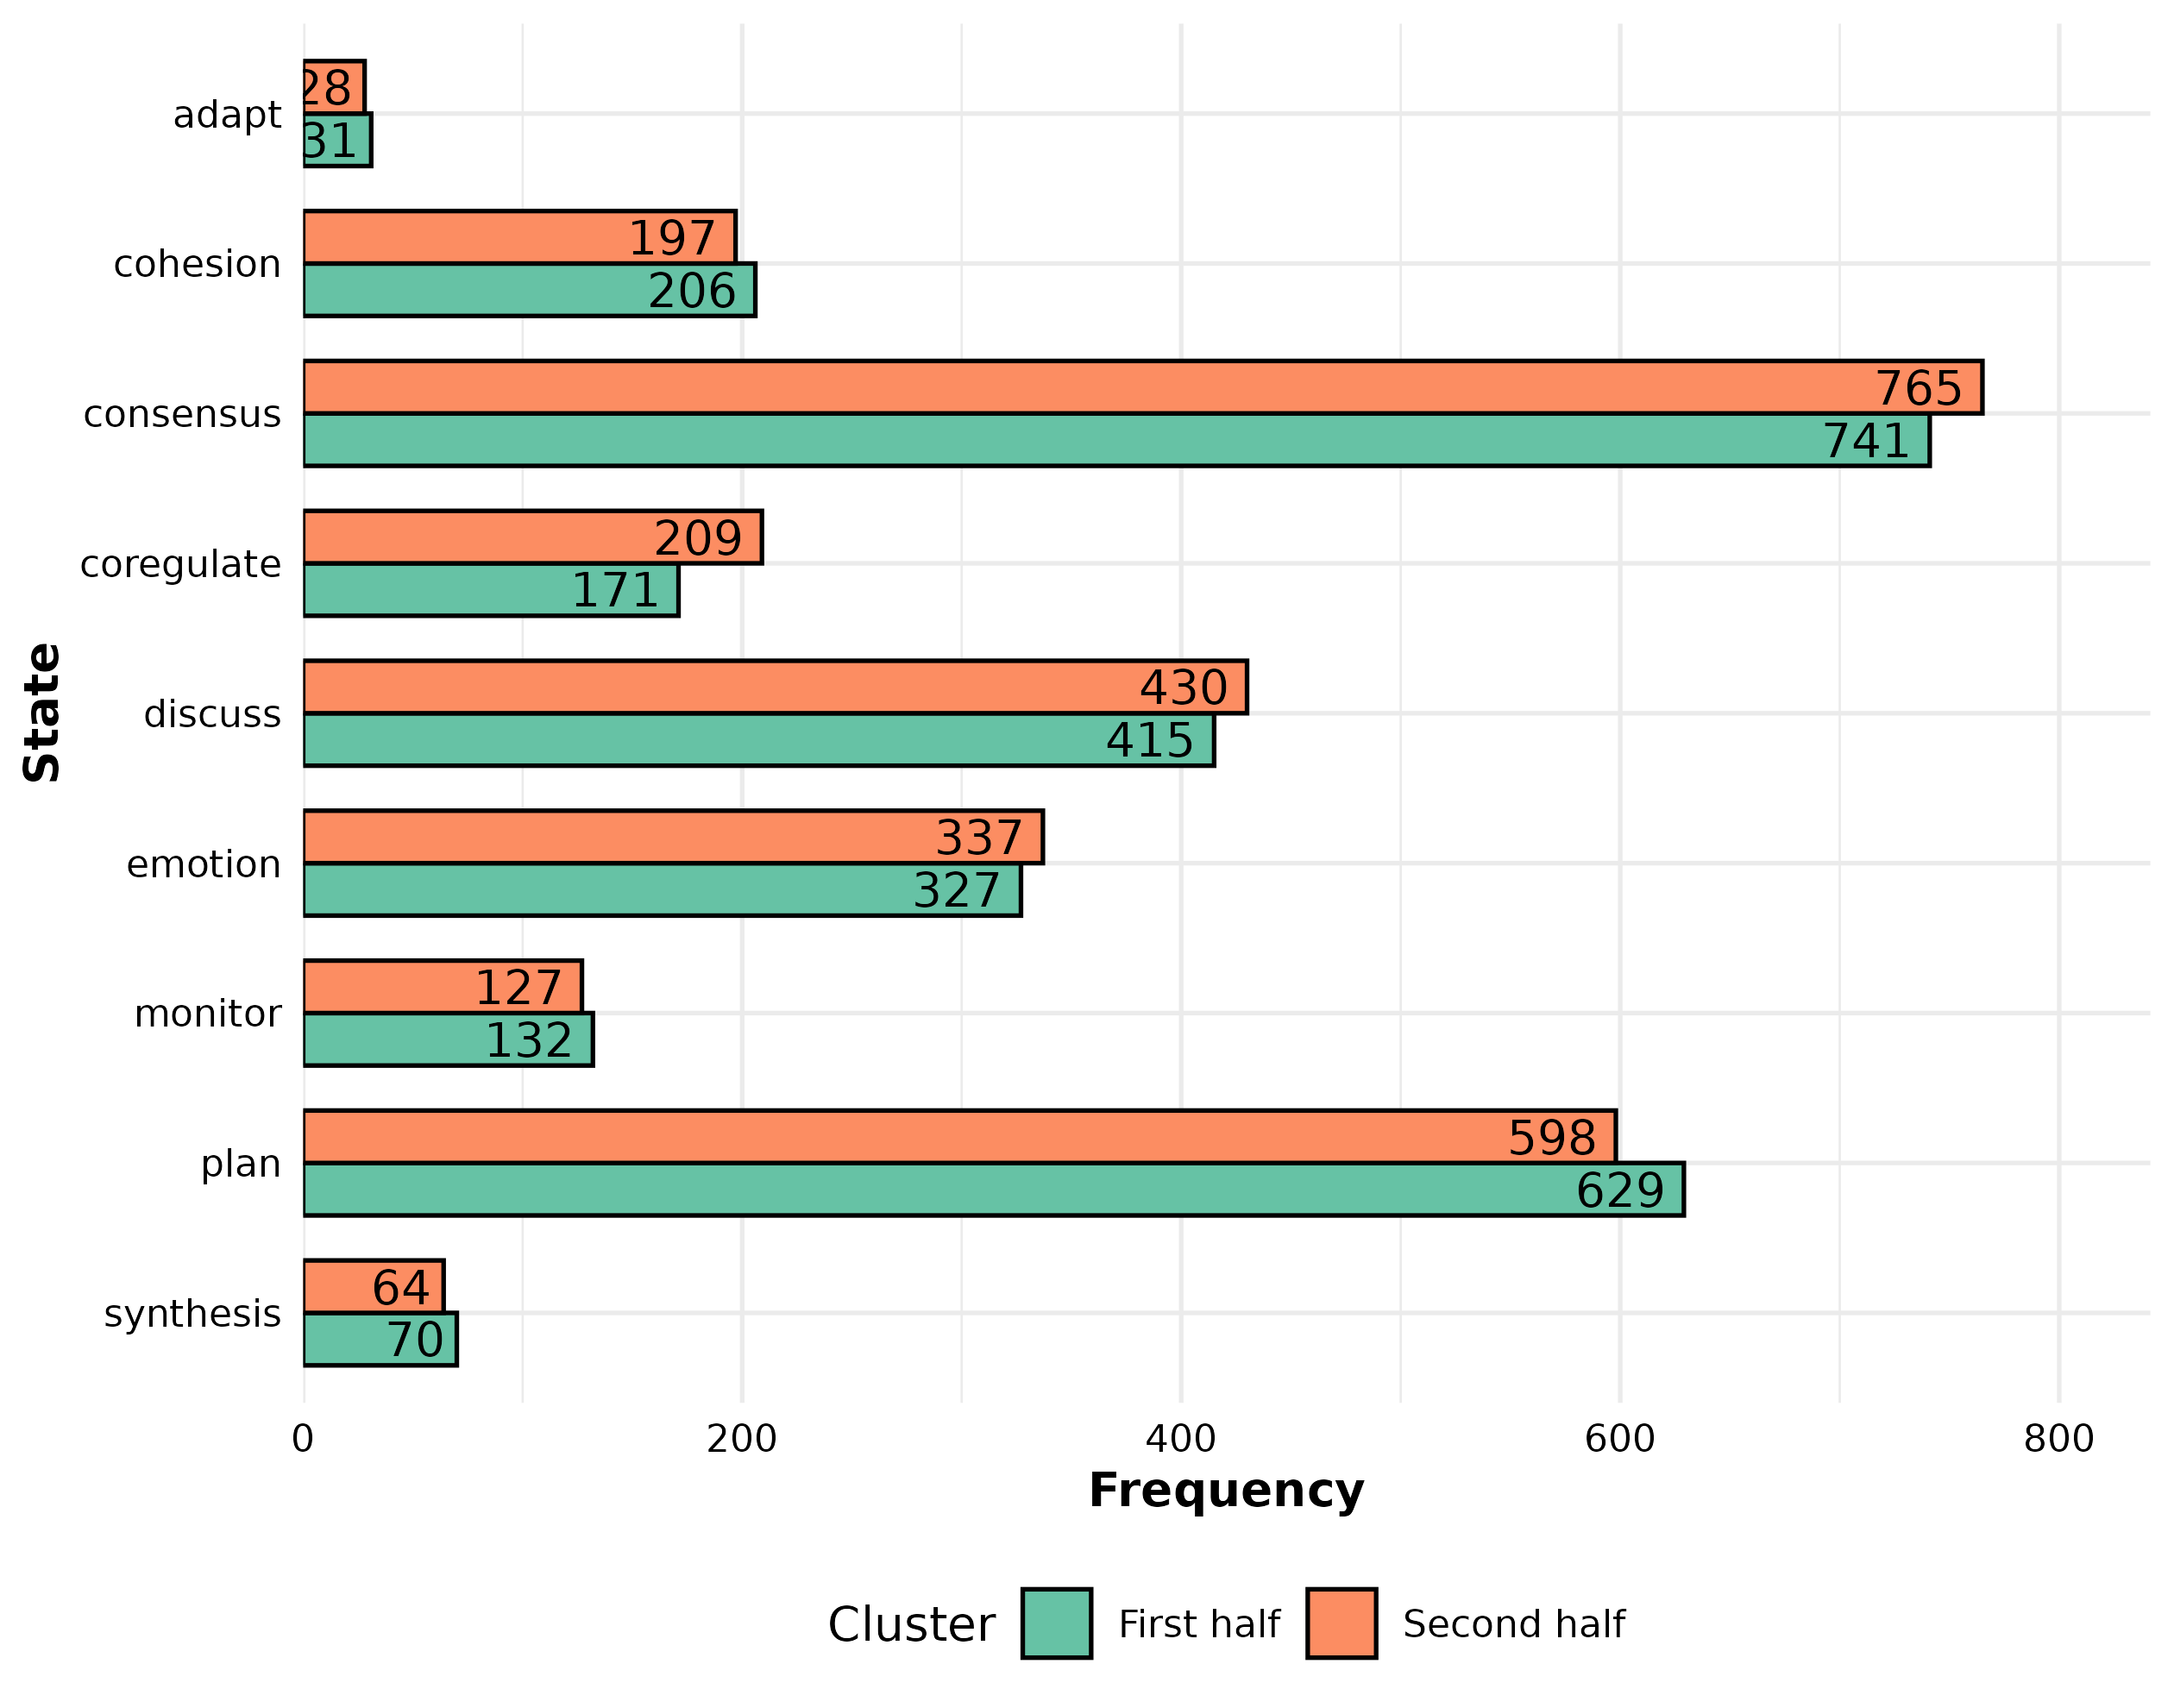
Mosaic plots
Exercises mosaic methods for frequency TNA, grouped frequency TNA,
and prepared tna_data objects.
tna::plot_mosaic(frequency_model)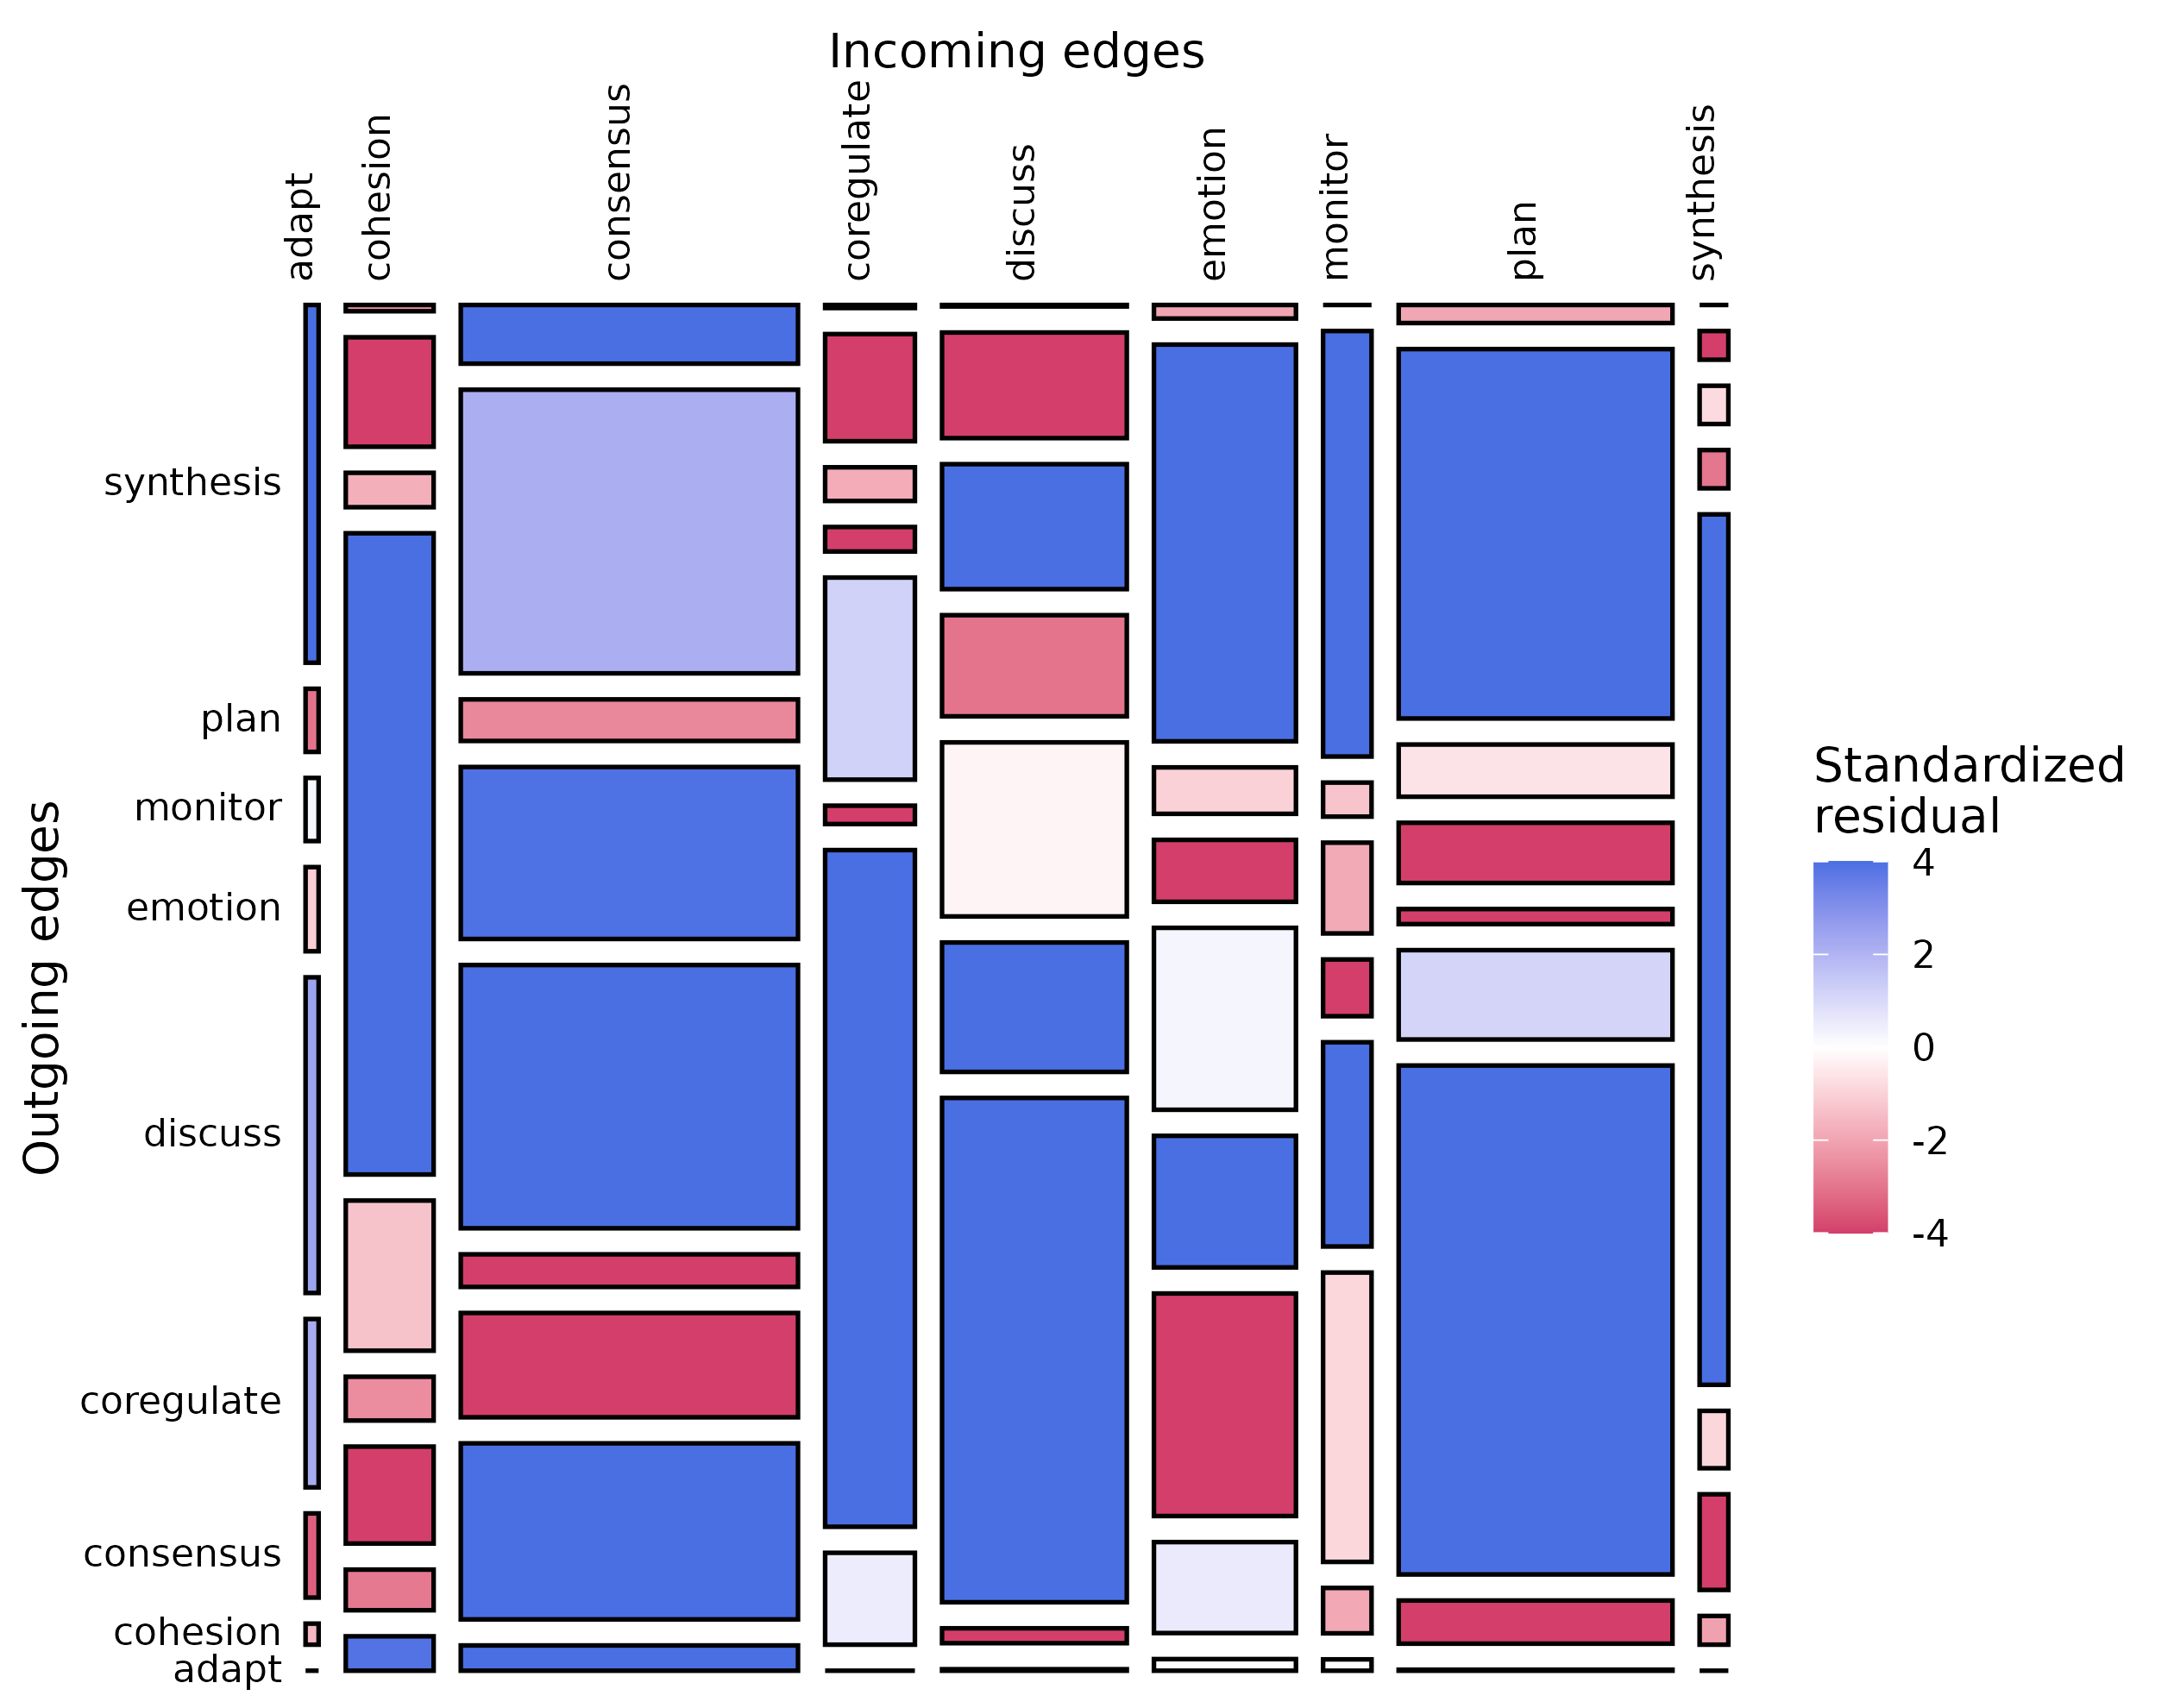
tna::plot_mosaic(group_frequency_models)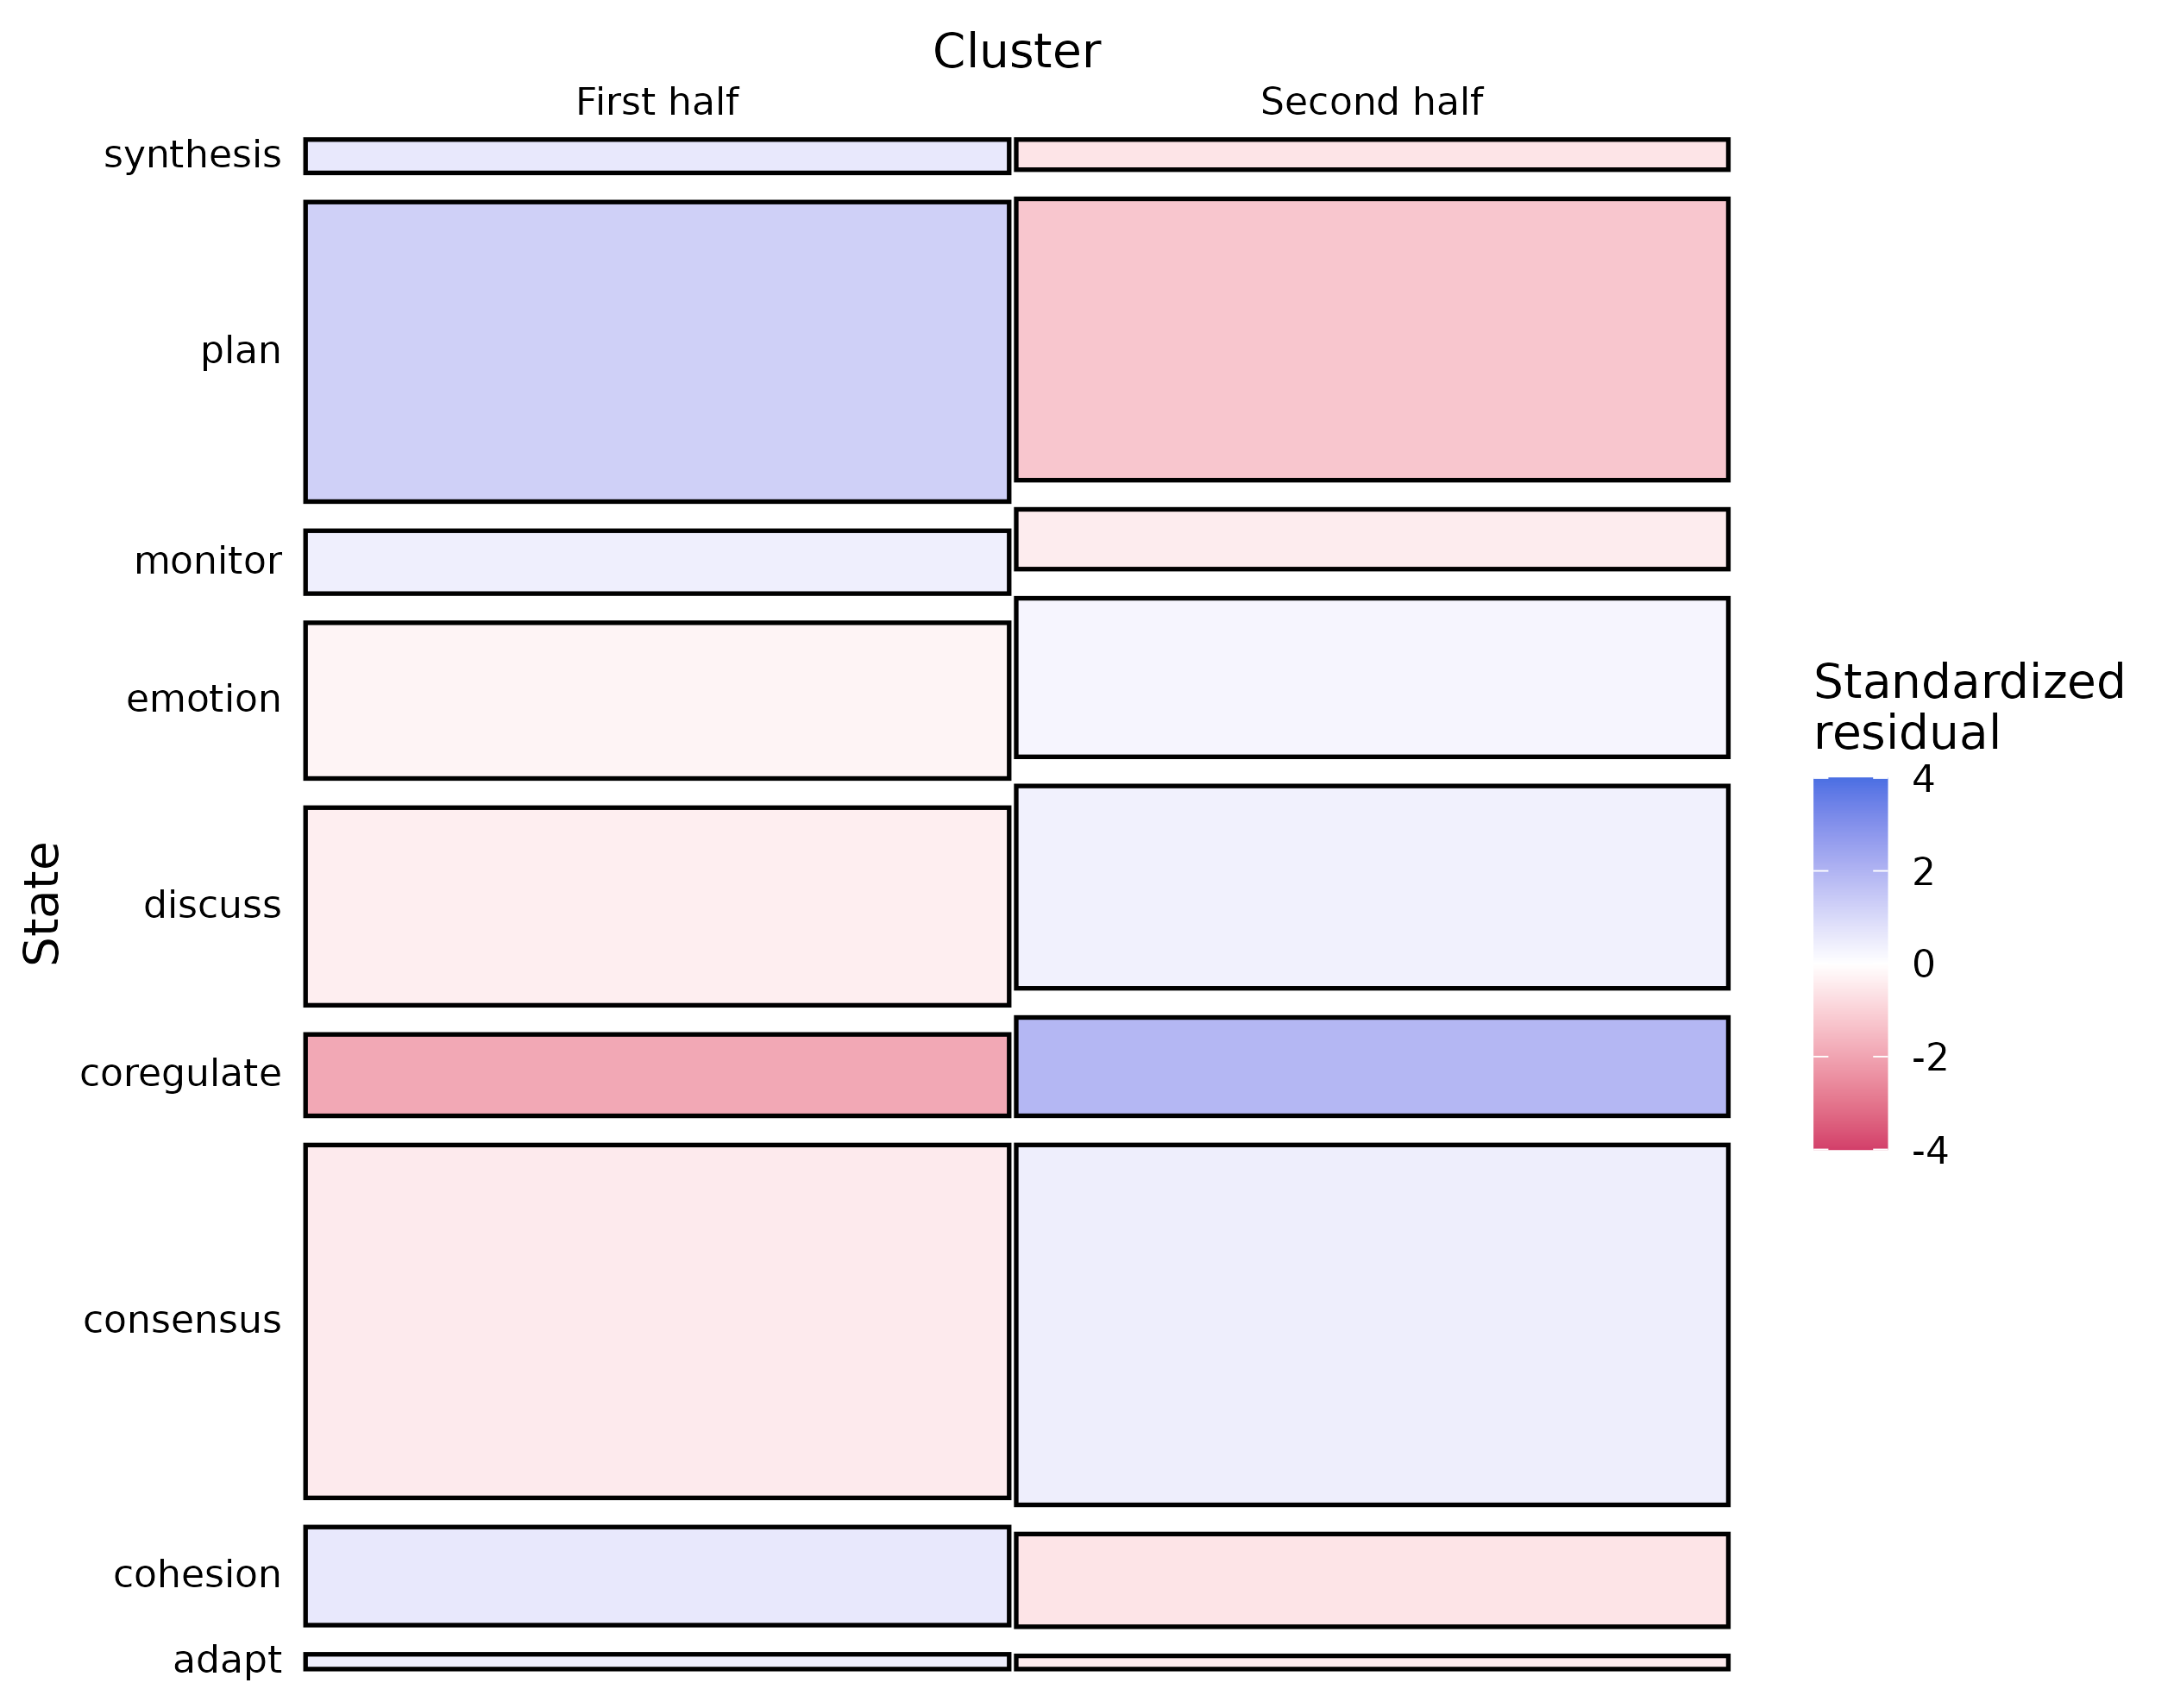
tna::plot_mosaic(prepared_data, group = "cohort")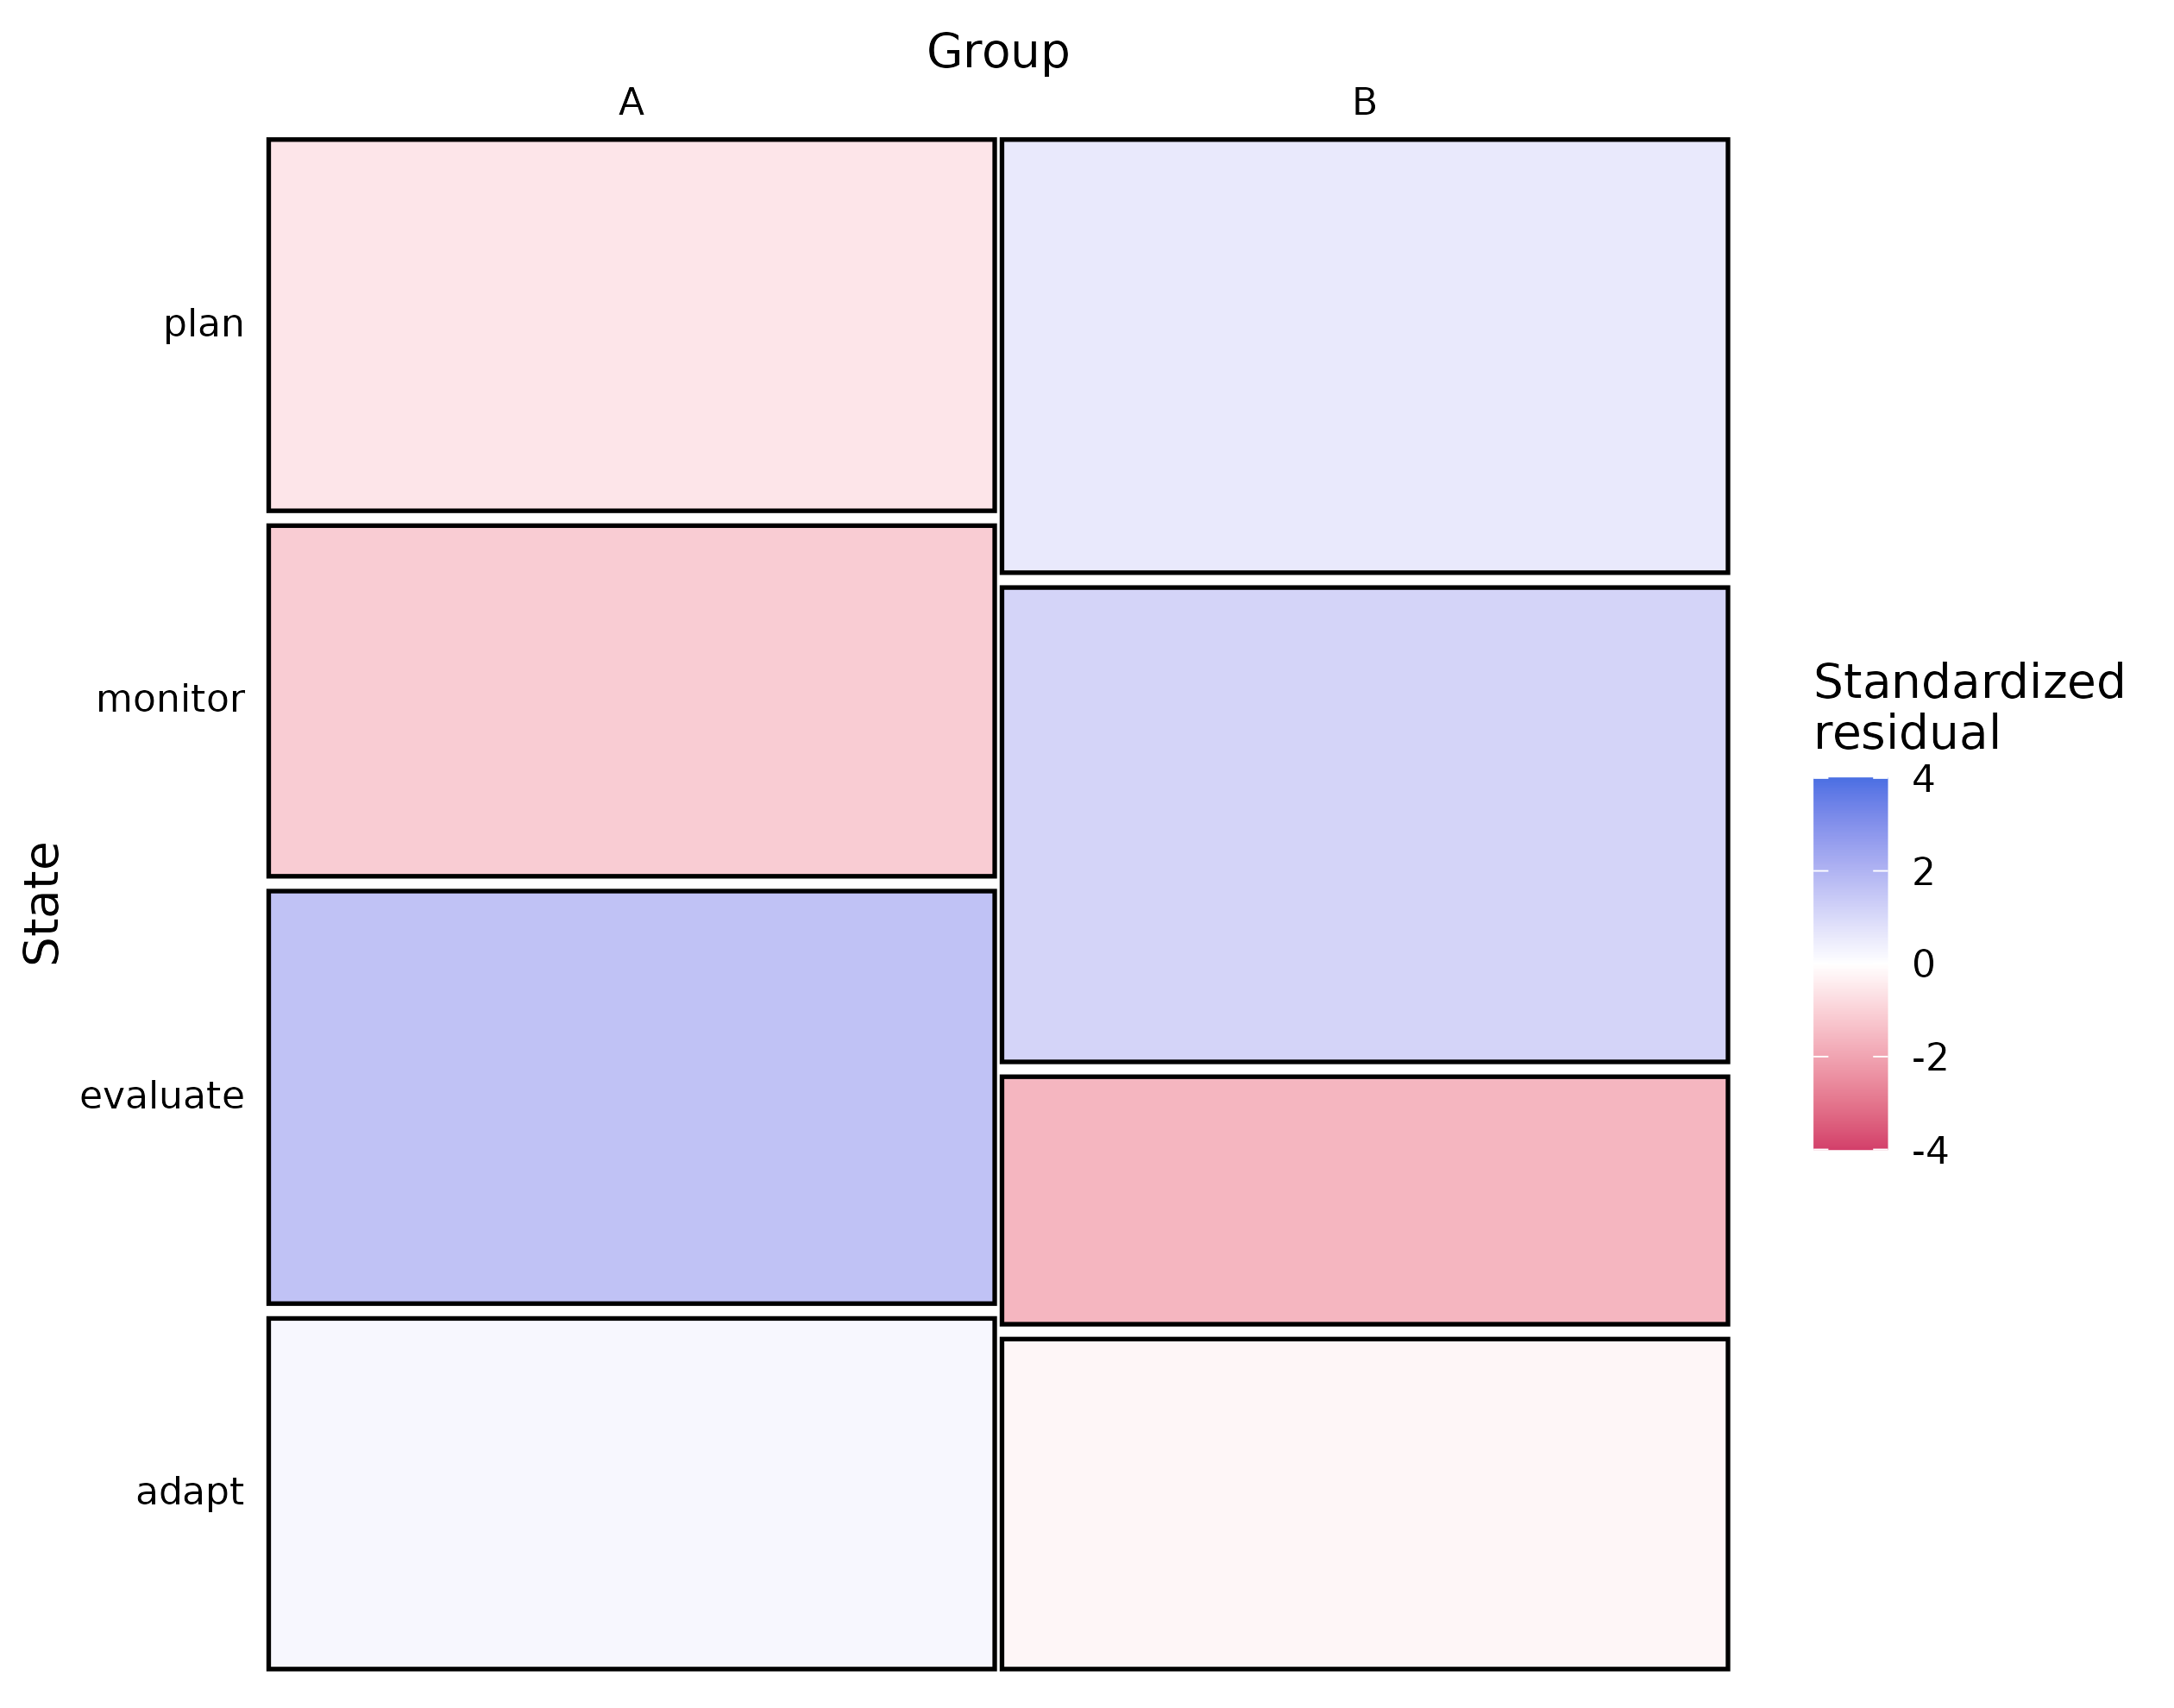
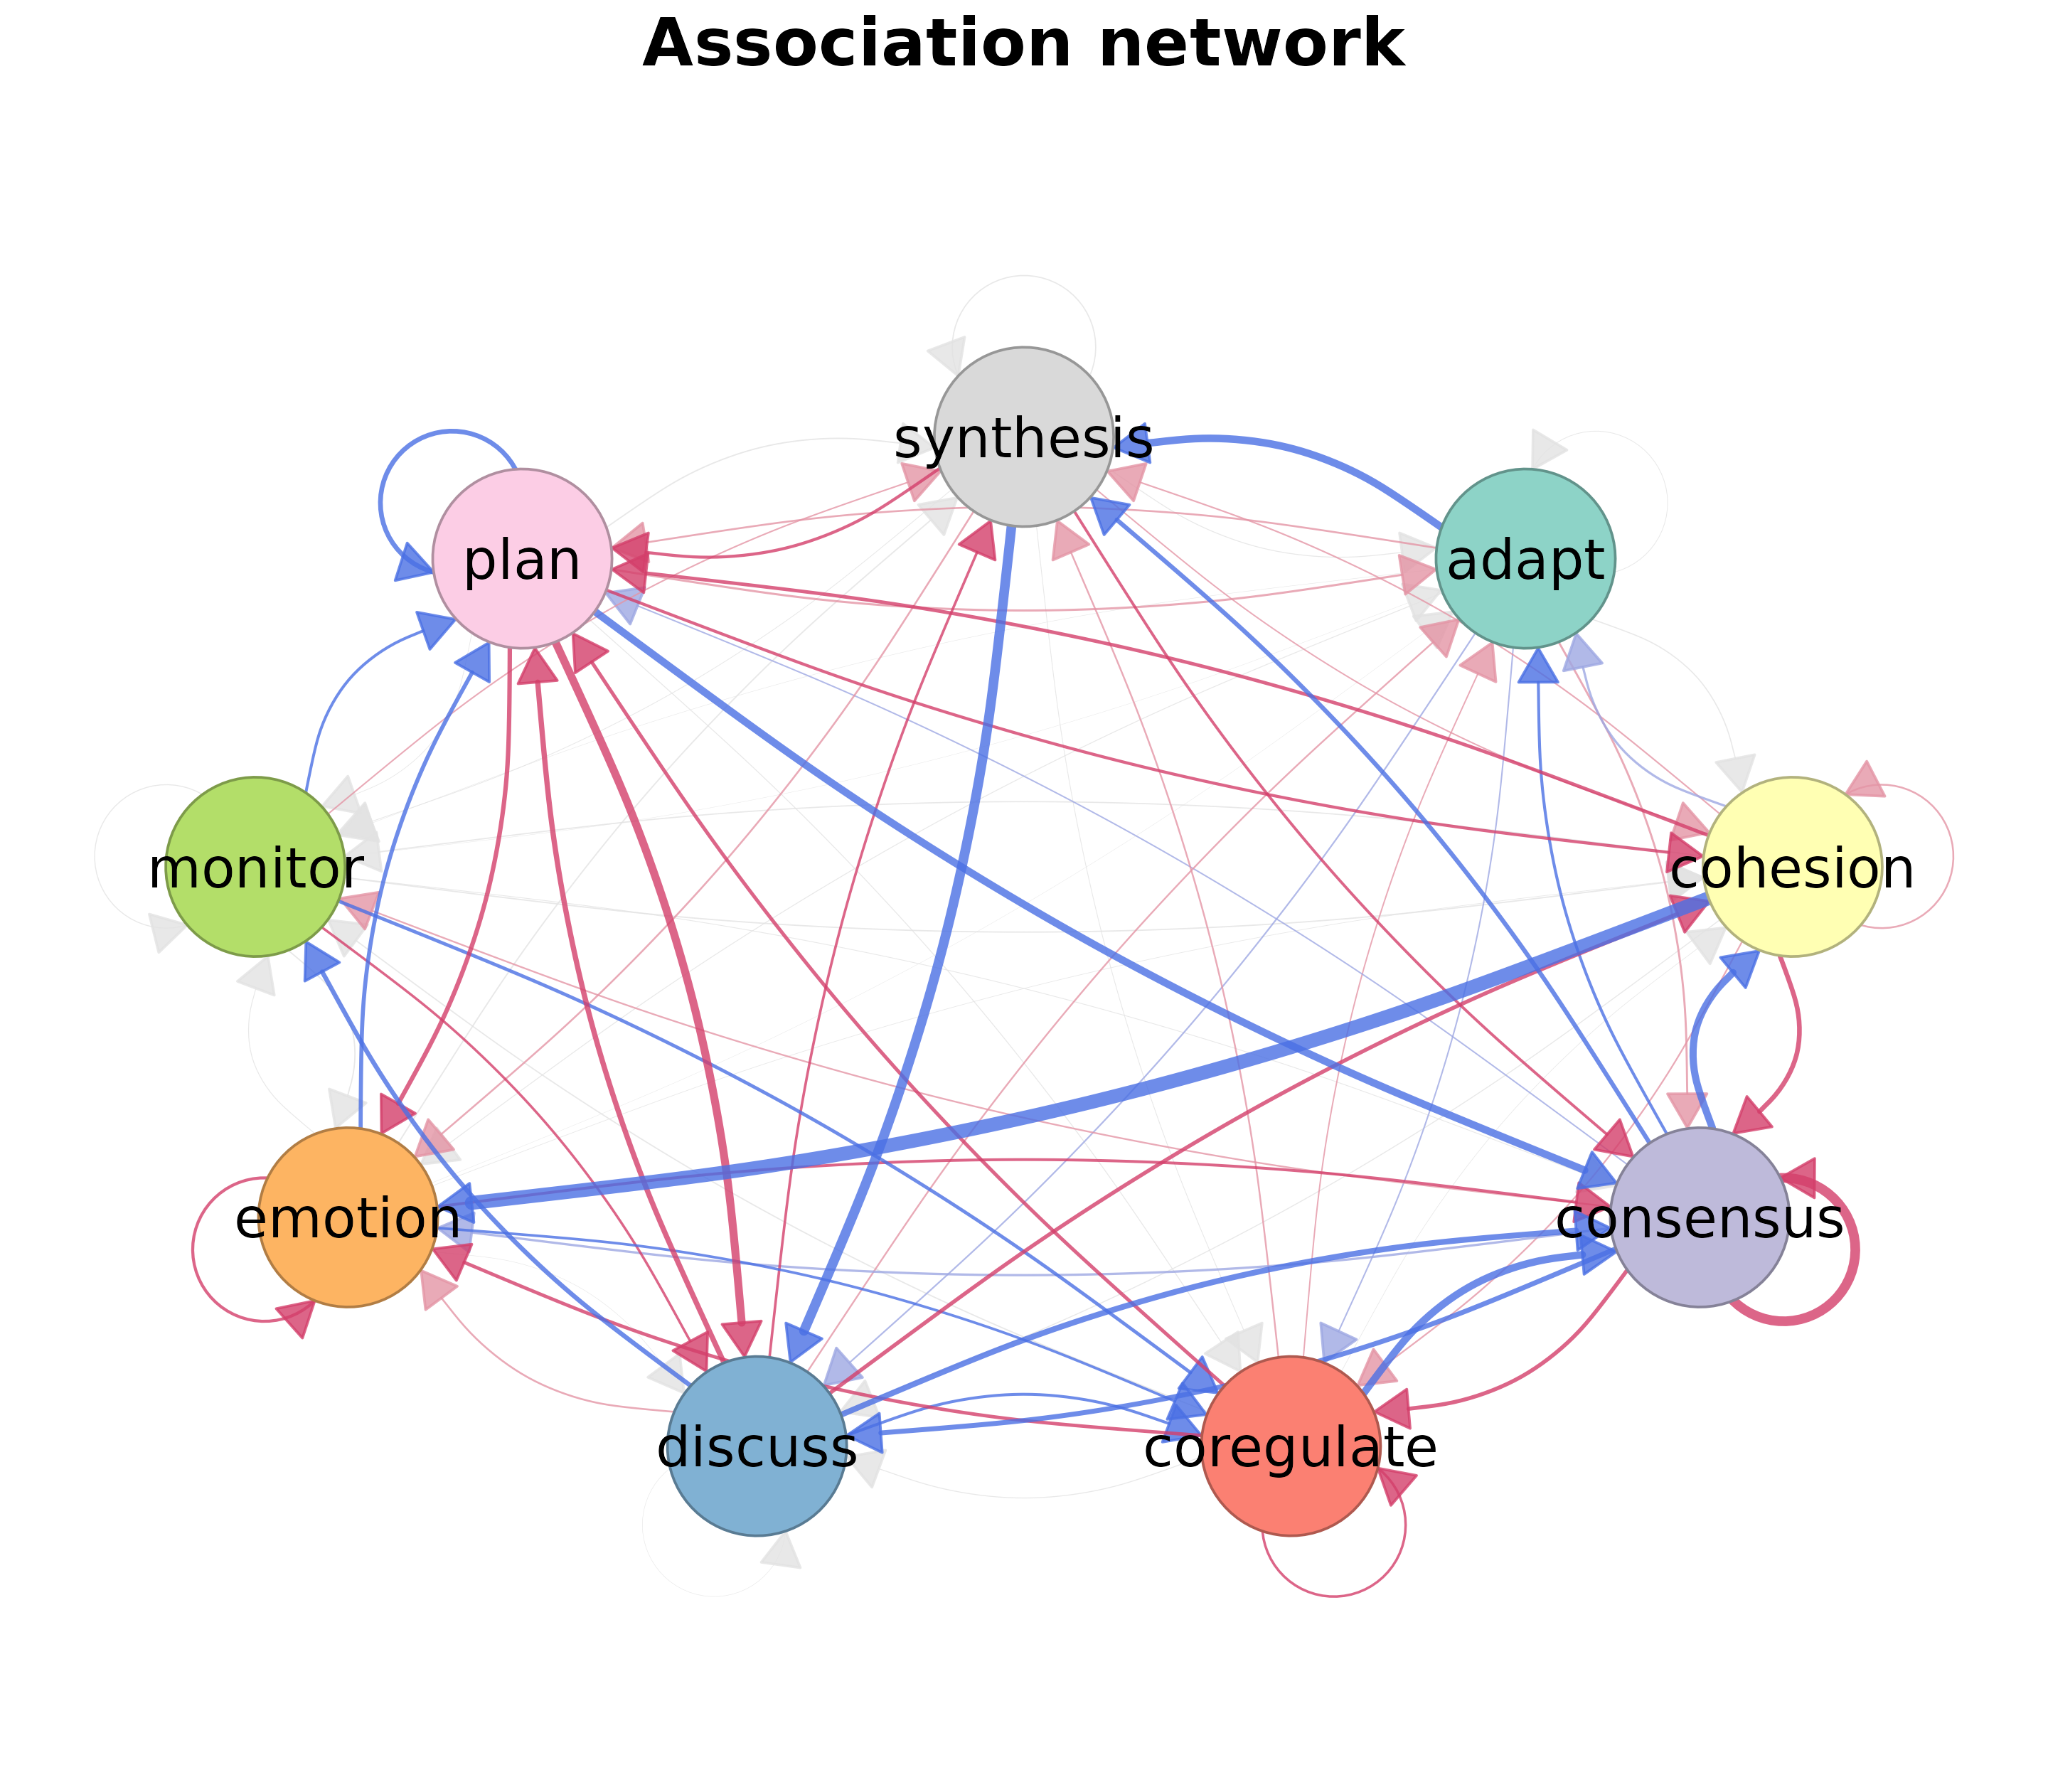
Association network
Exercises plot_associations.tna() using the required
integer-valued frequency model.
tna::plot_associations(
  frequency_model,
  title = "Association network"
)
Sequence plots
Single-model index and distribution plots
Exercises plot_sequences.tna() in both modes.
tna::plot_sequences(model, type = "index", tick = 1)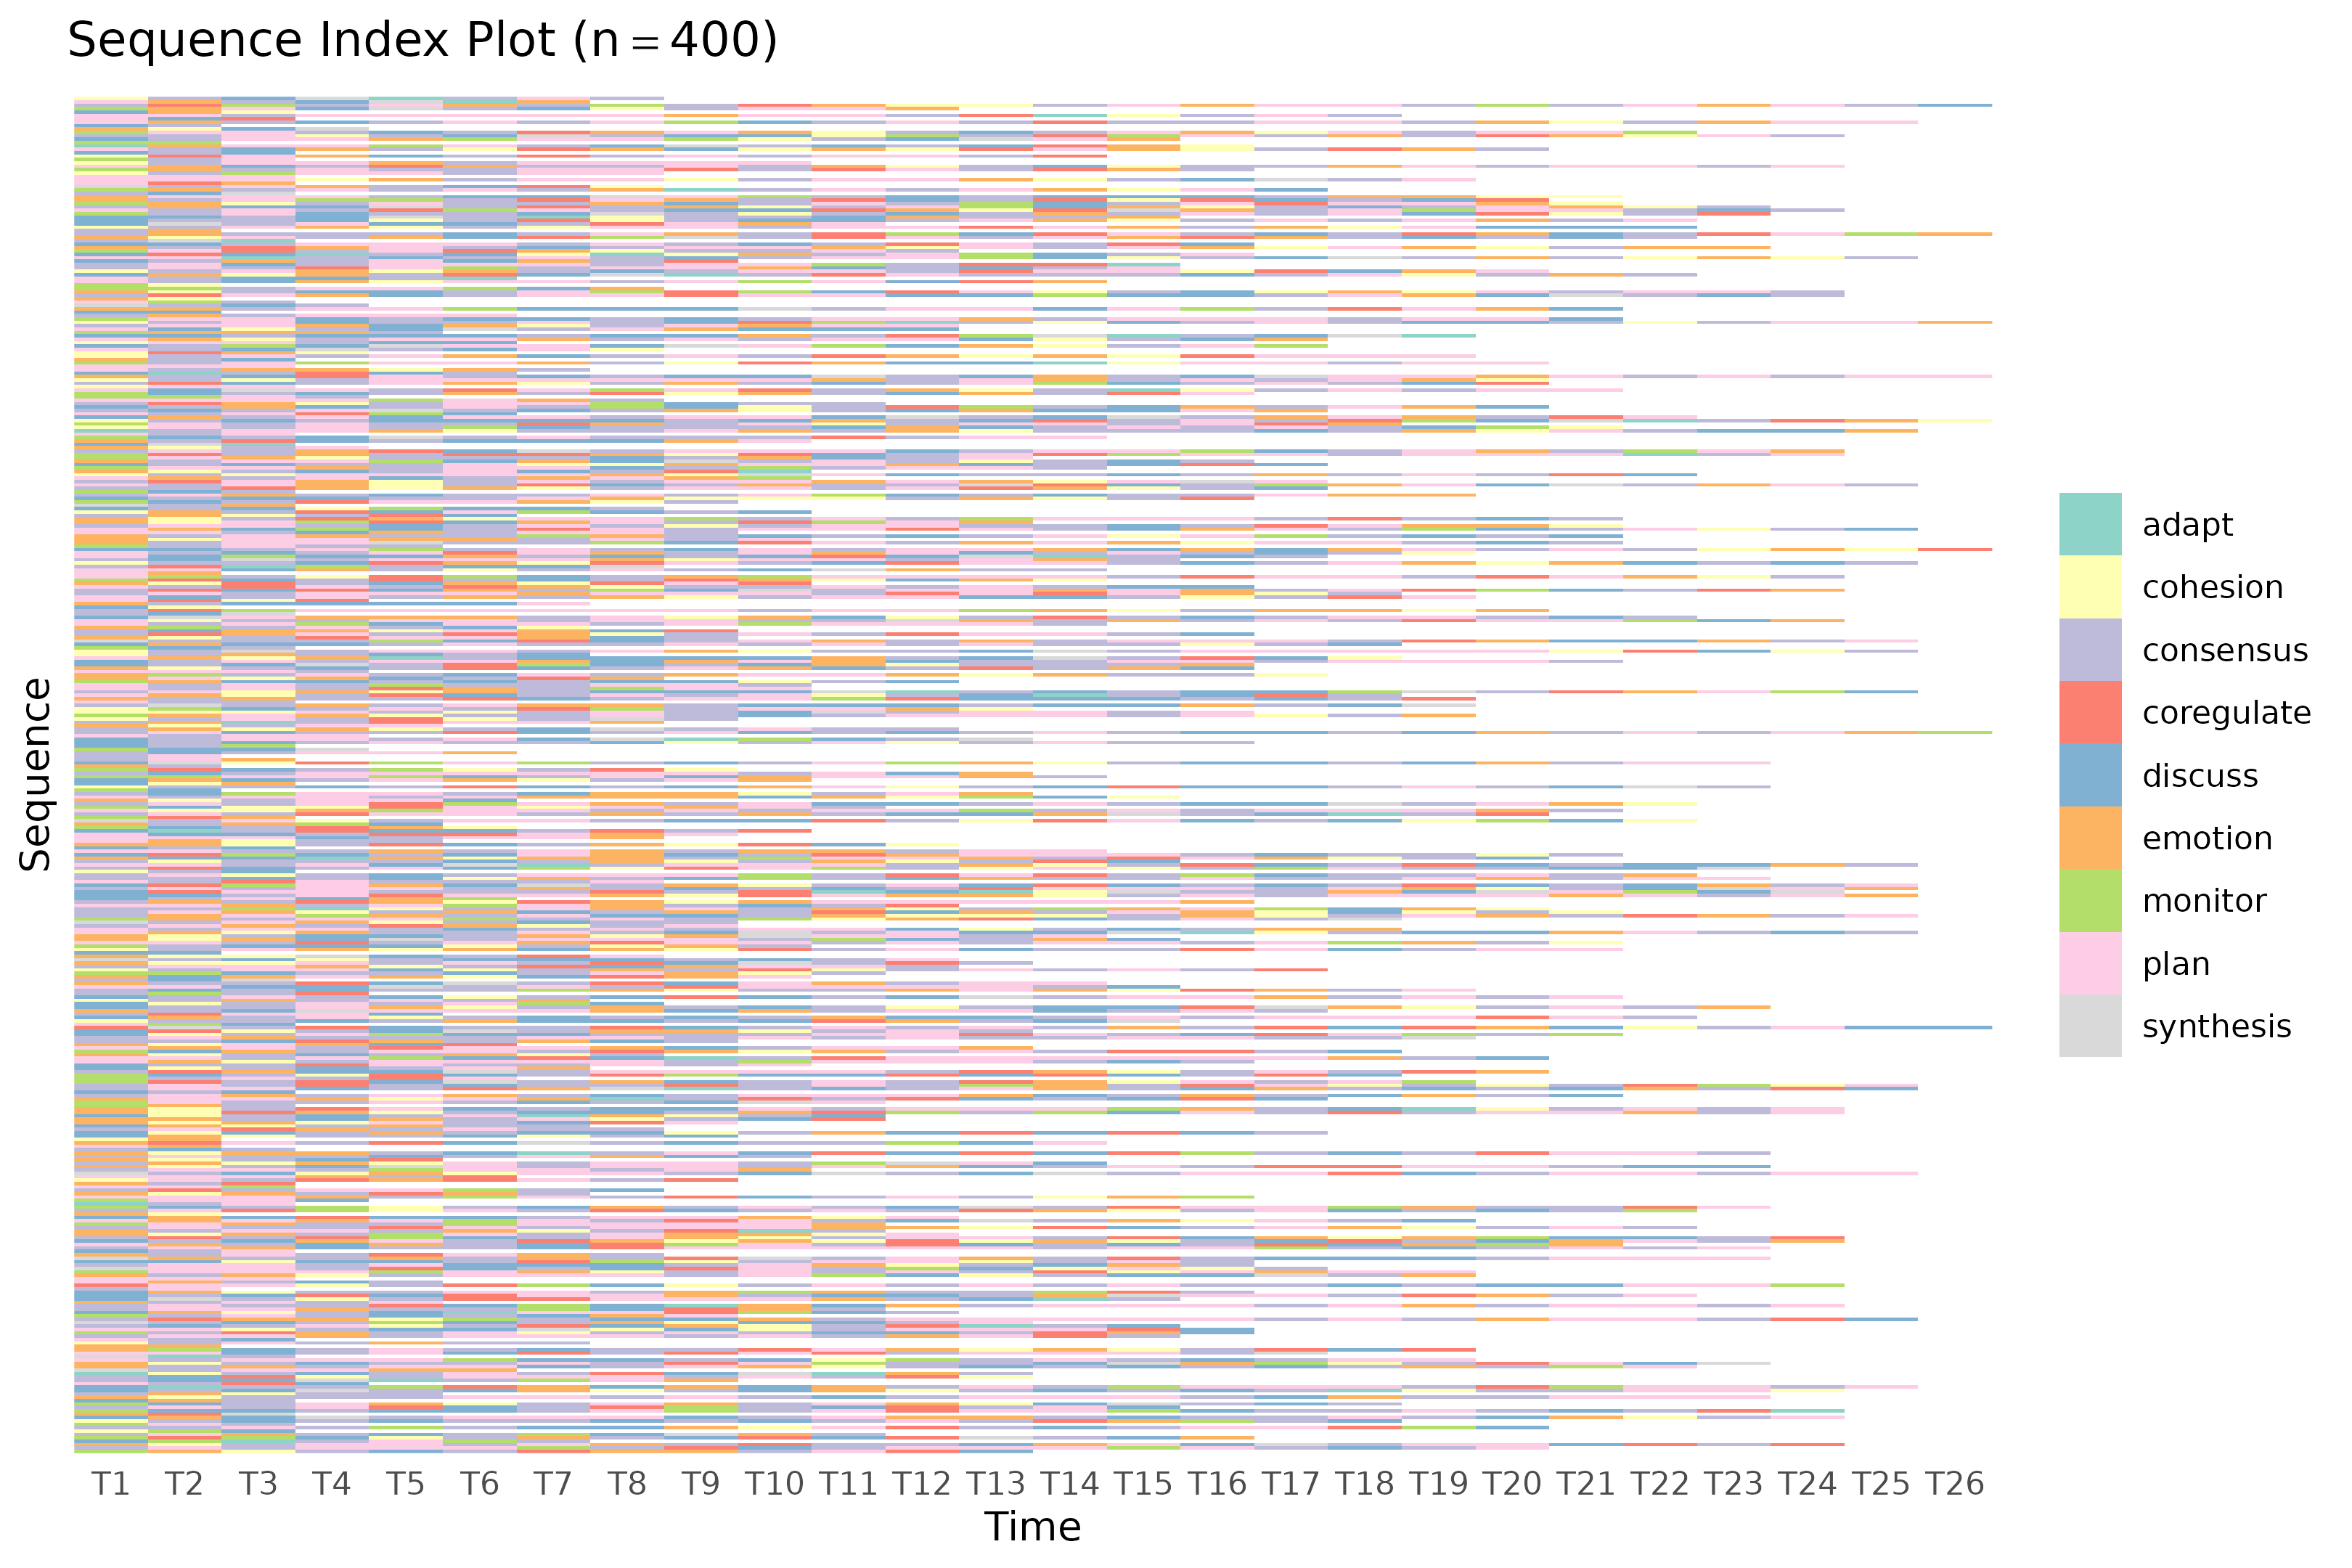
tna::plot_sequences(model, type = "distribution", geom = "area", tick = 1)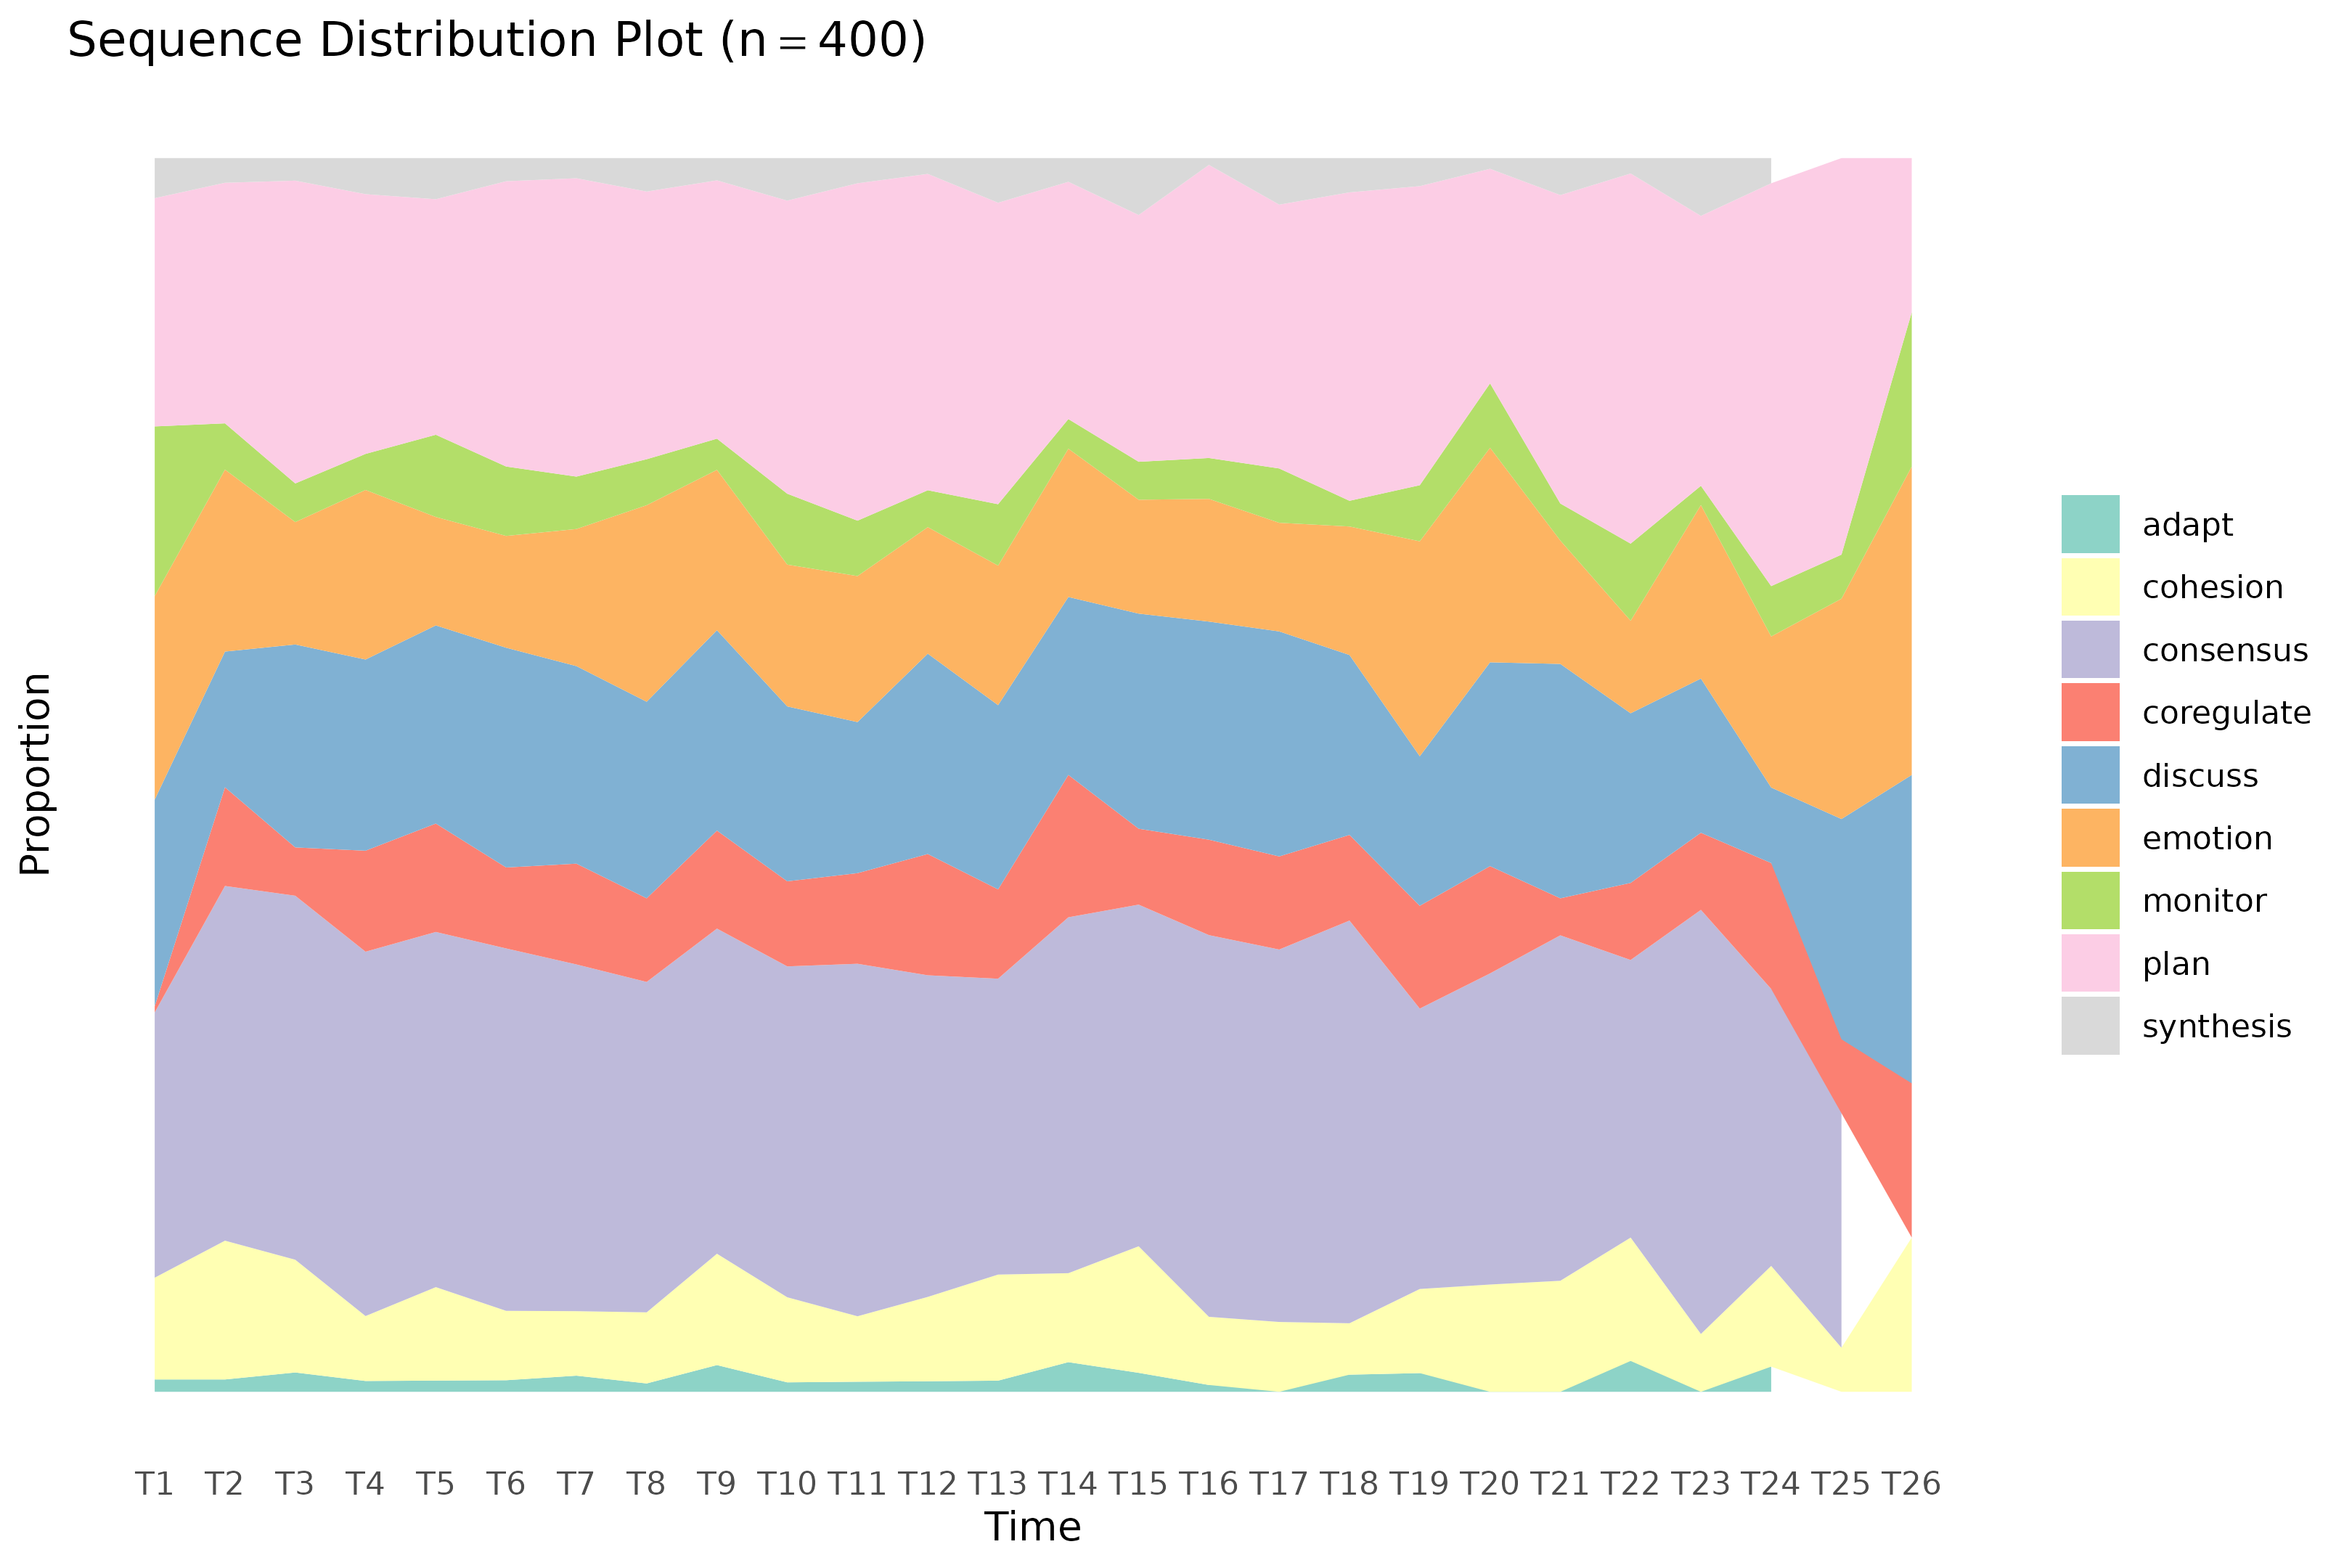
Grouped sequences
Exercises plot_sequences.group_tna().
tna::plot_sequences(group_models, type = "distribution", tick = 1)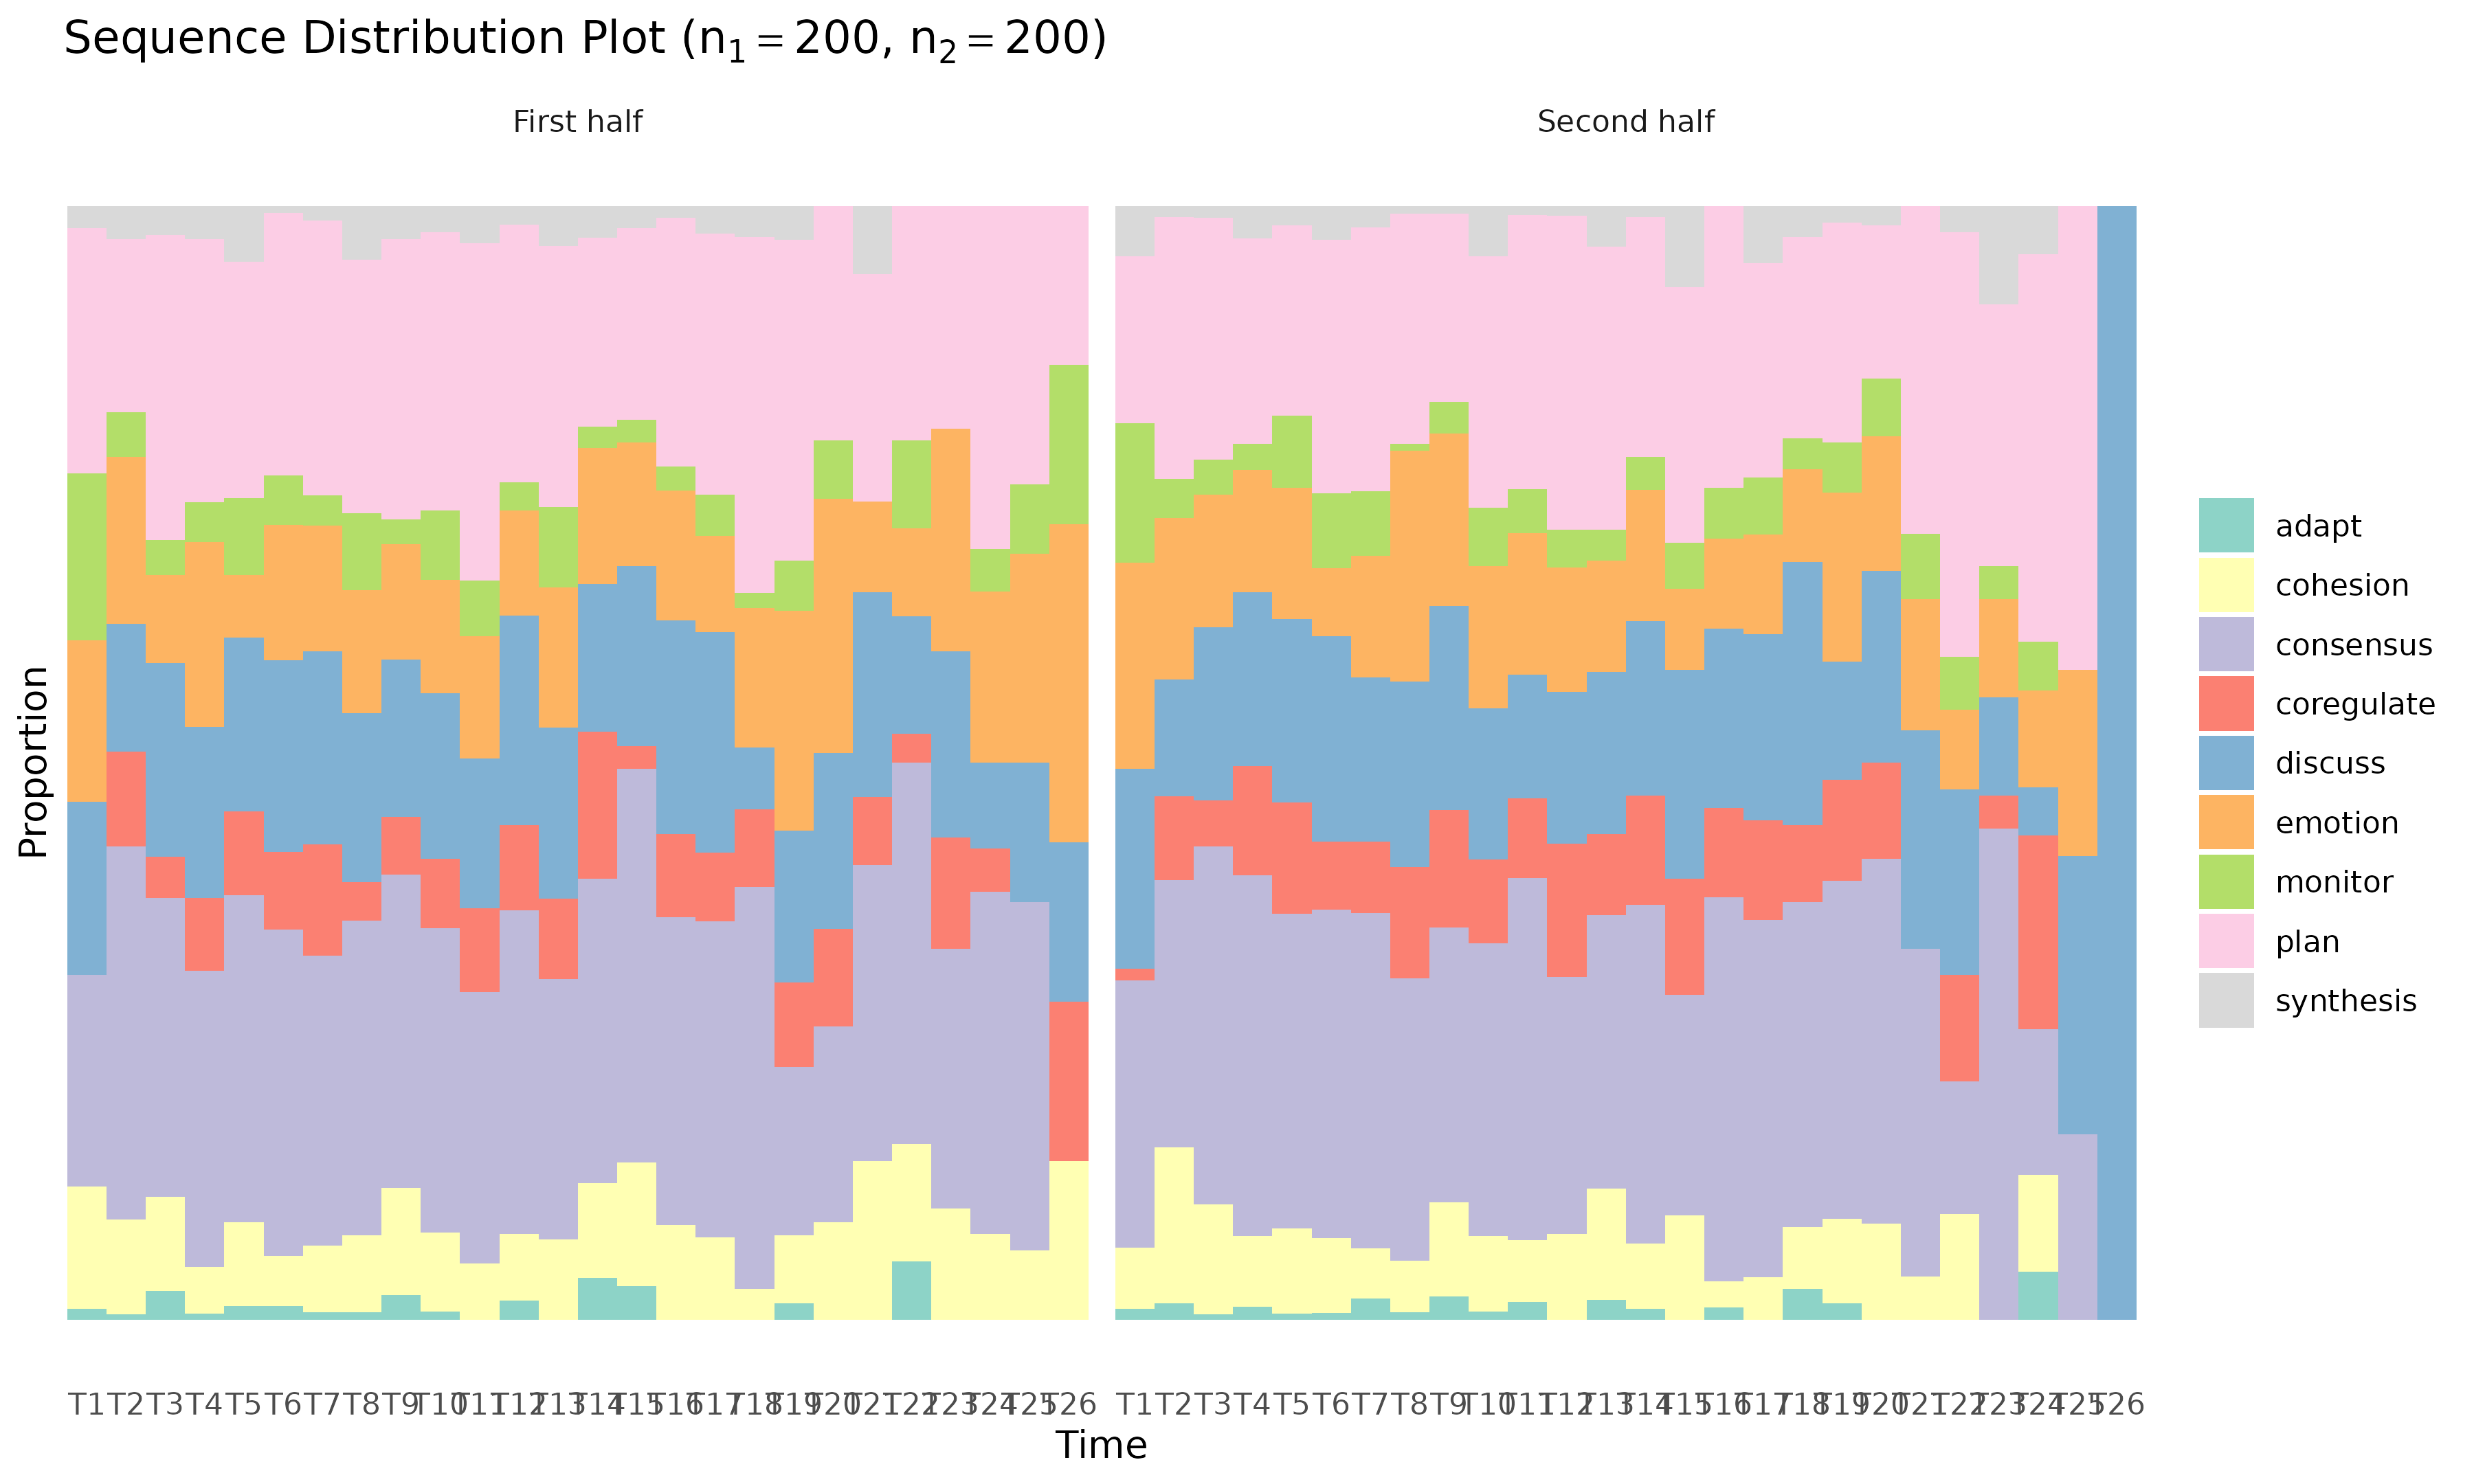
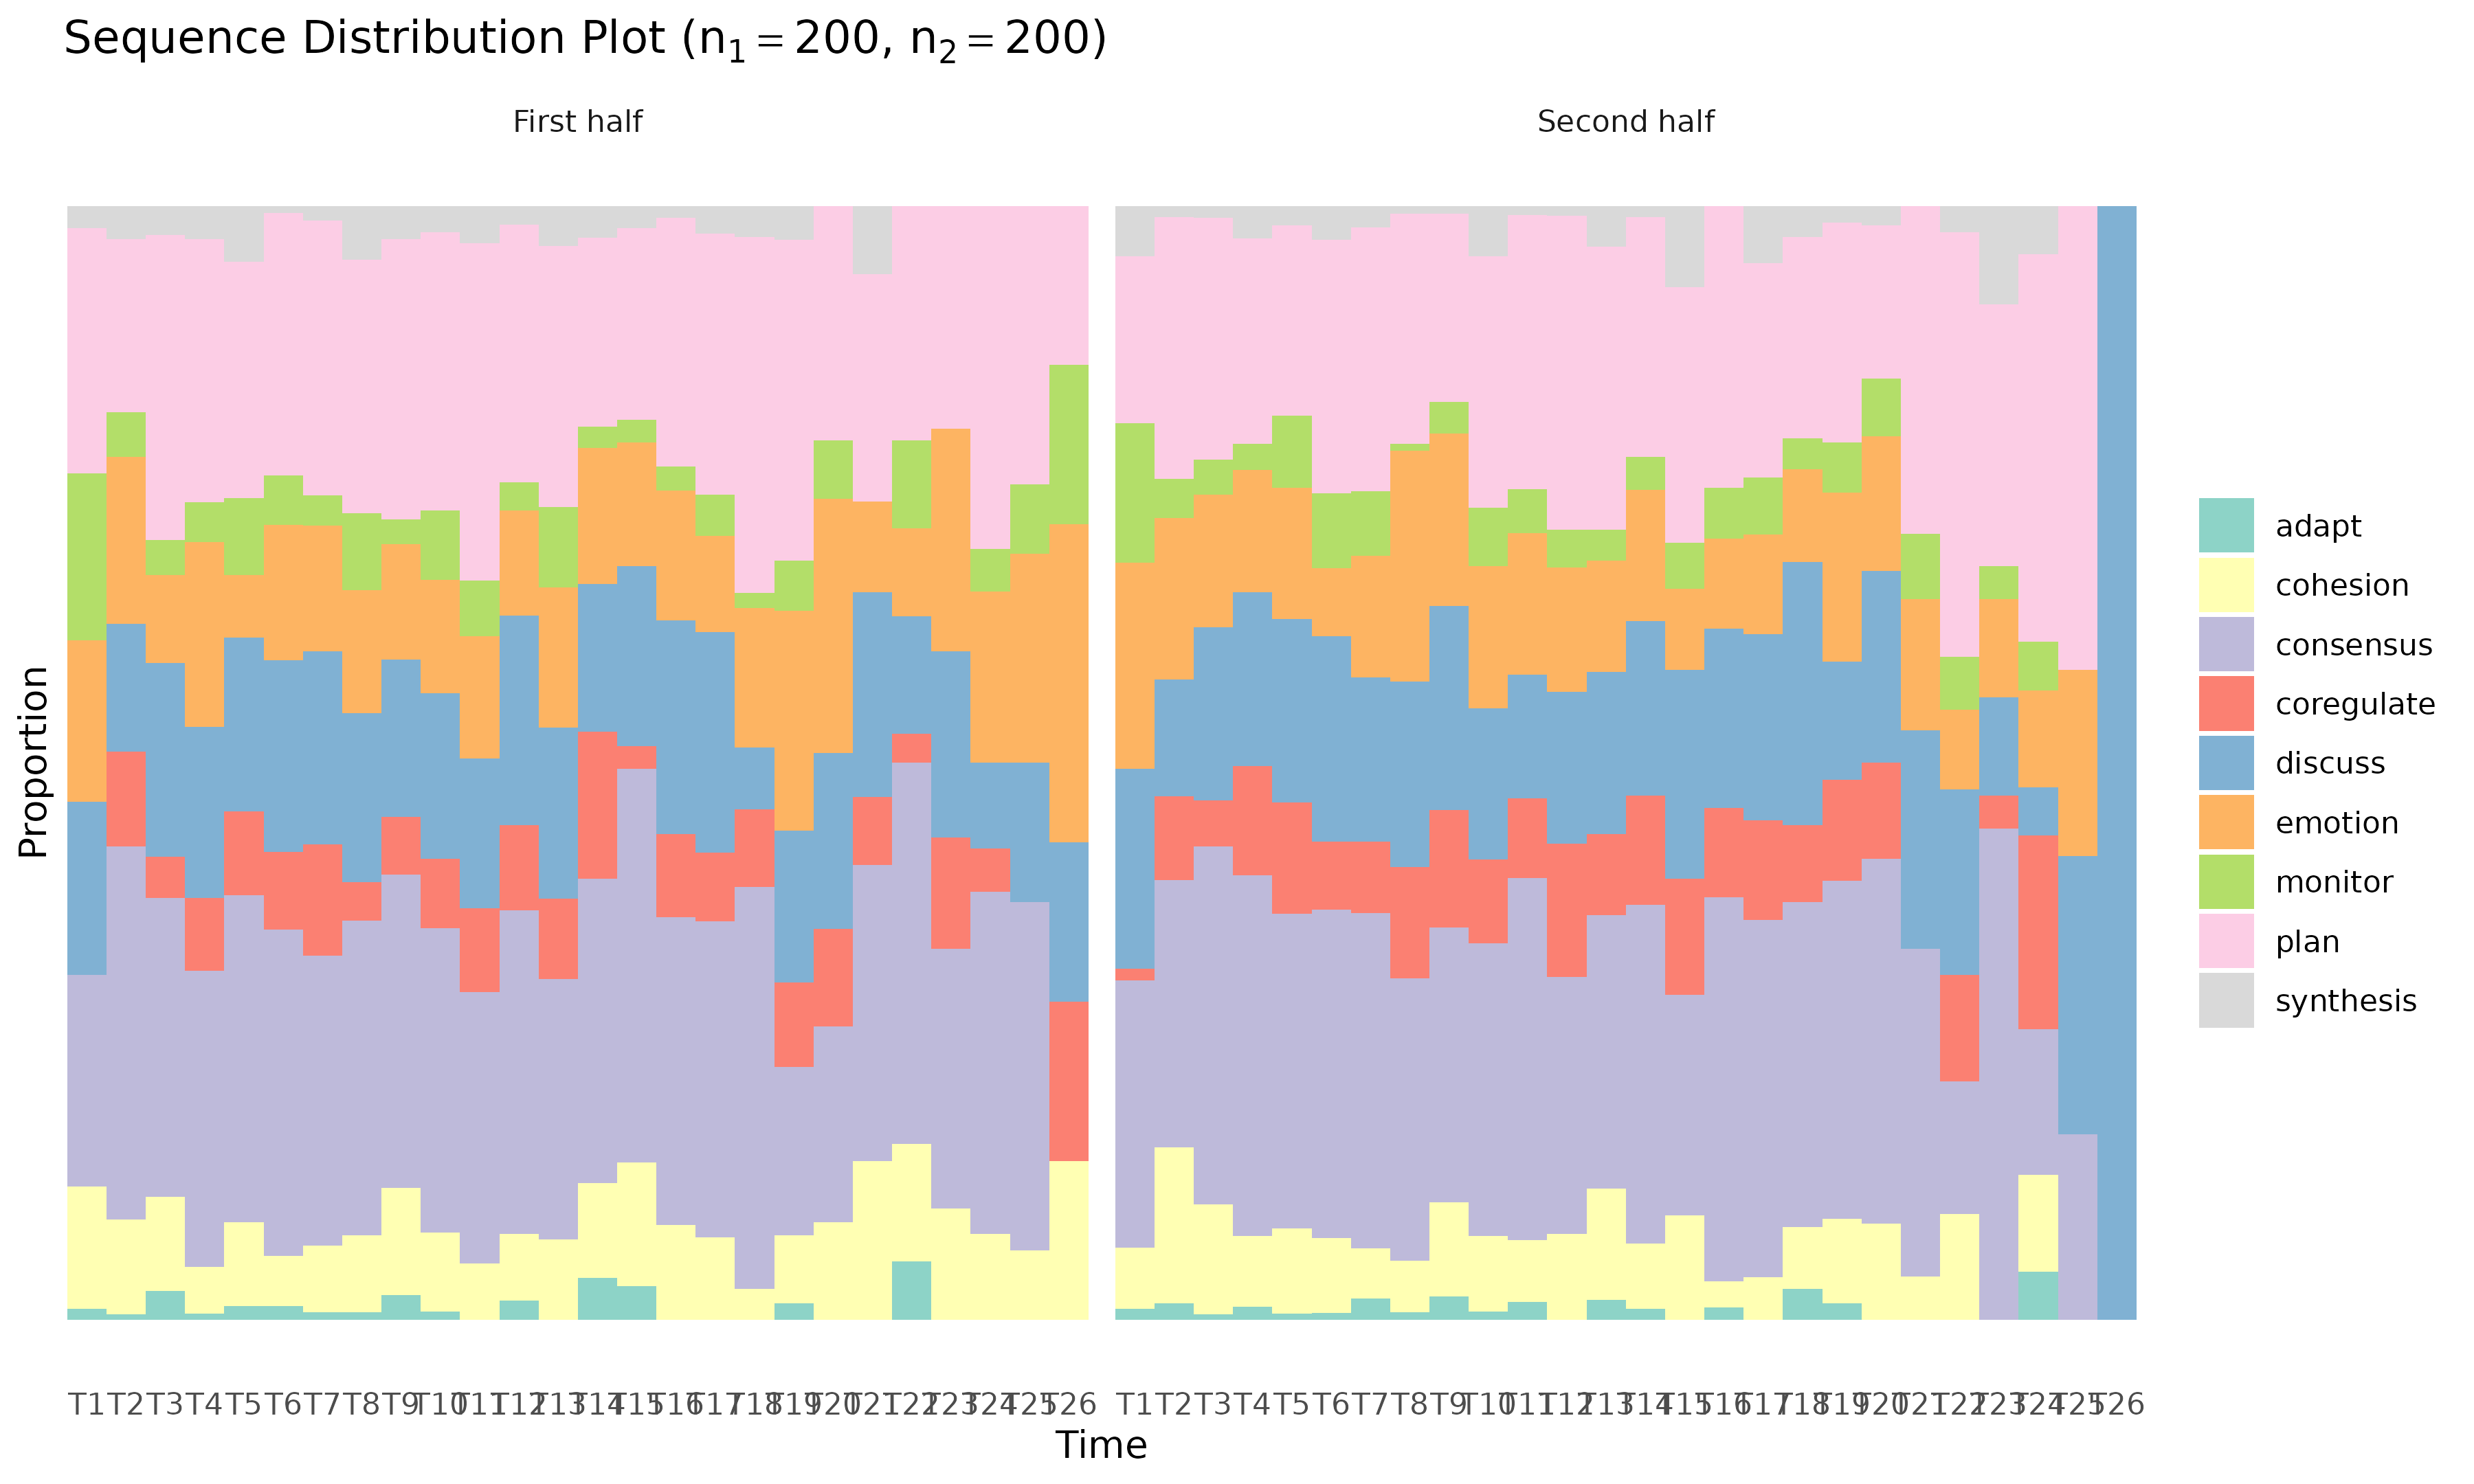
Data-frame sequences
Exercises plot_sequences.default() with an explicit
grouping vector.
tna::plot_sequences(
  gallery_data,
  group = gallery_group,
  type = "distribution",
  tick = 1
)
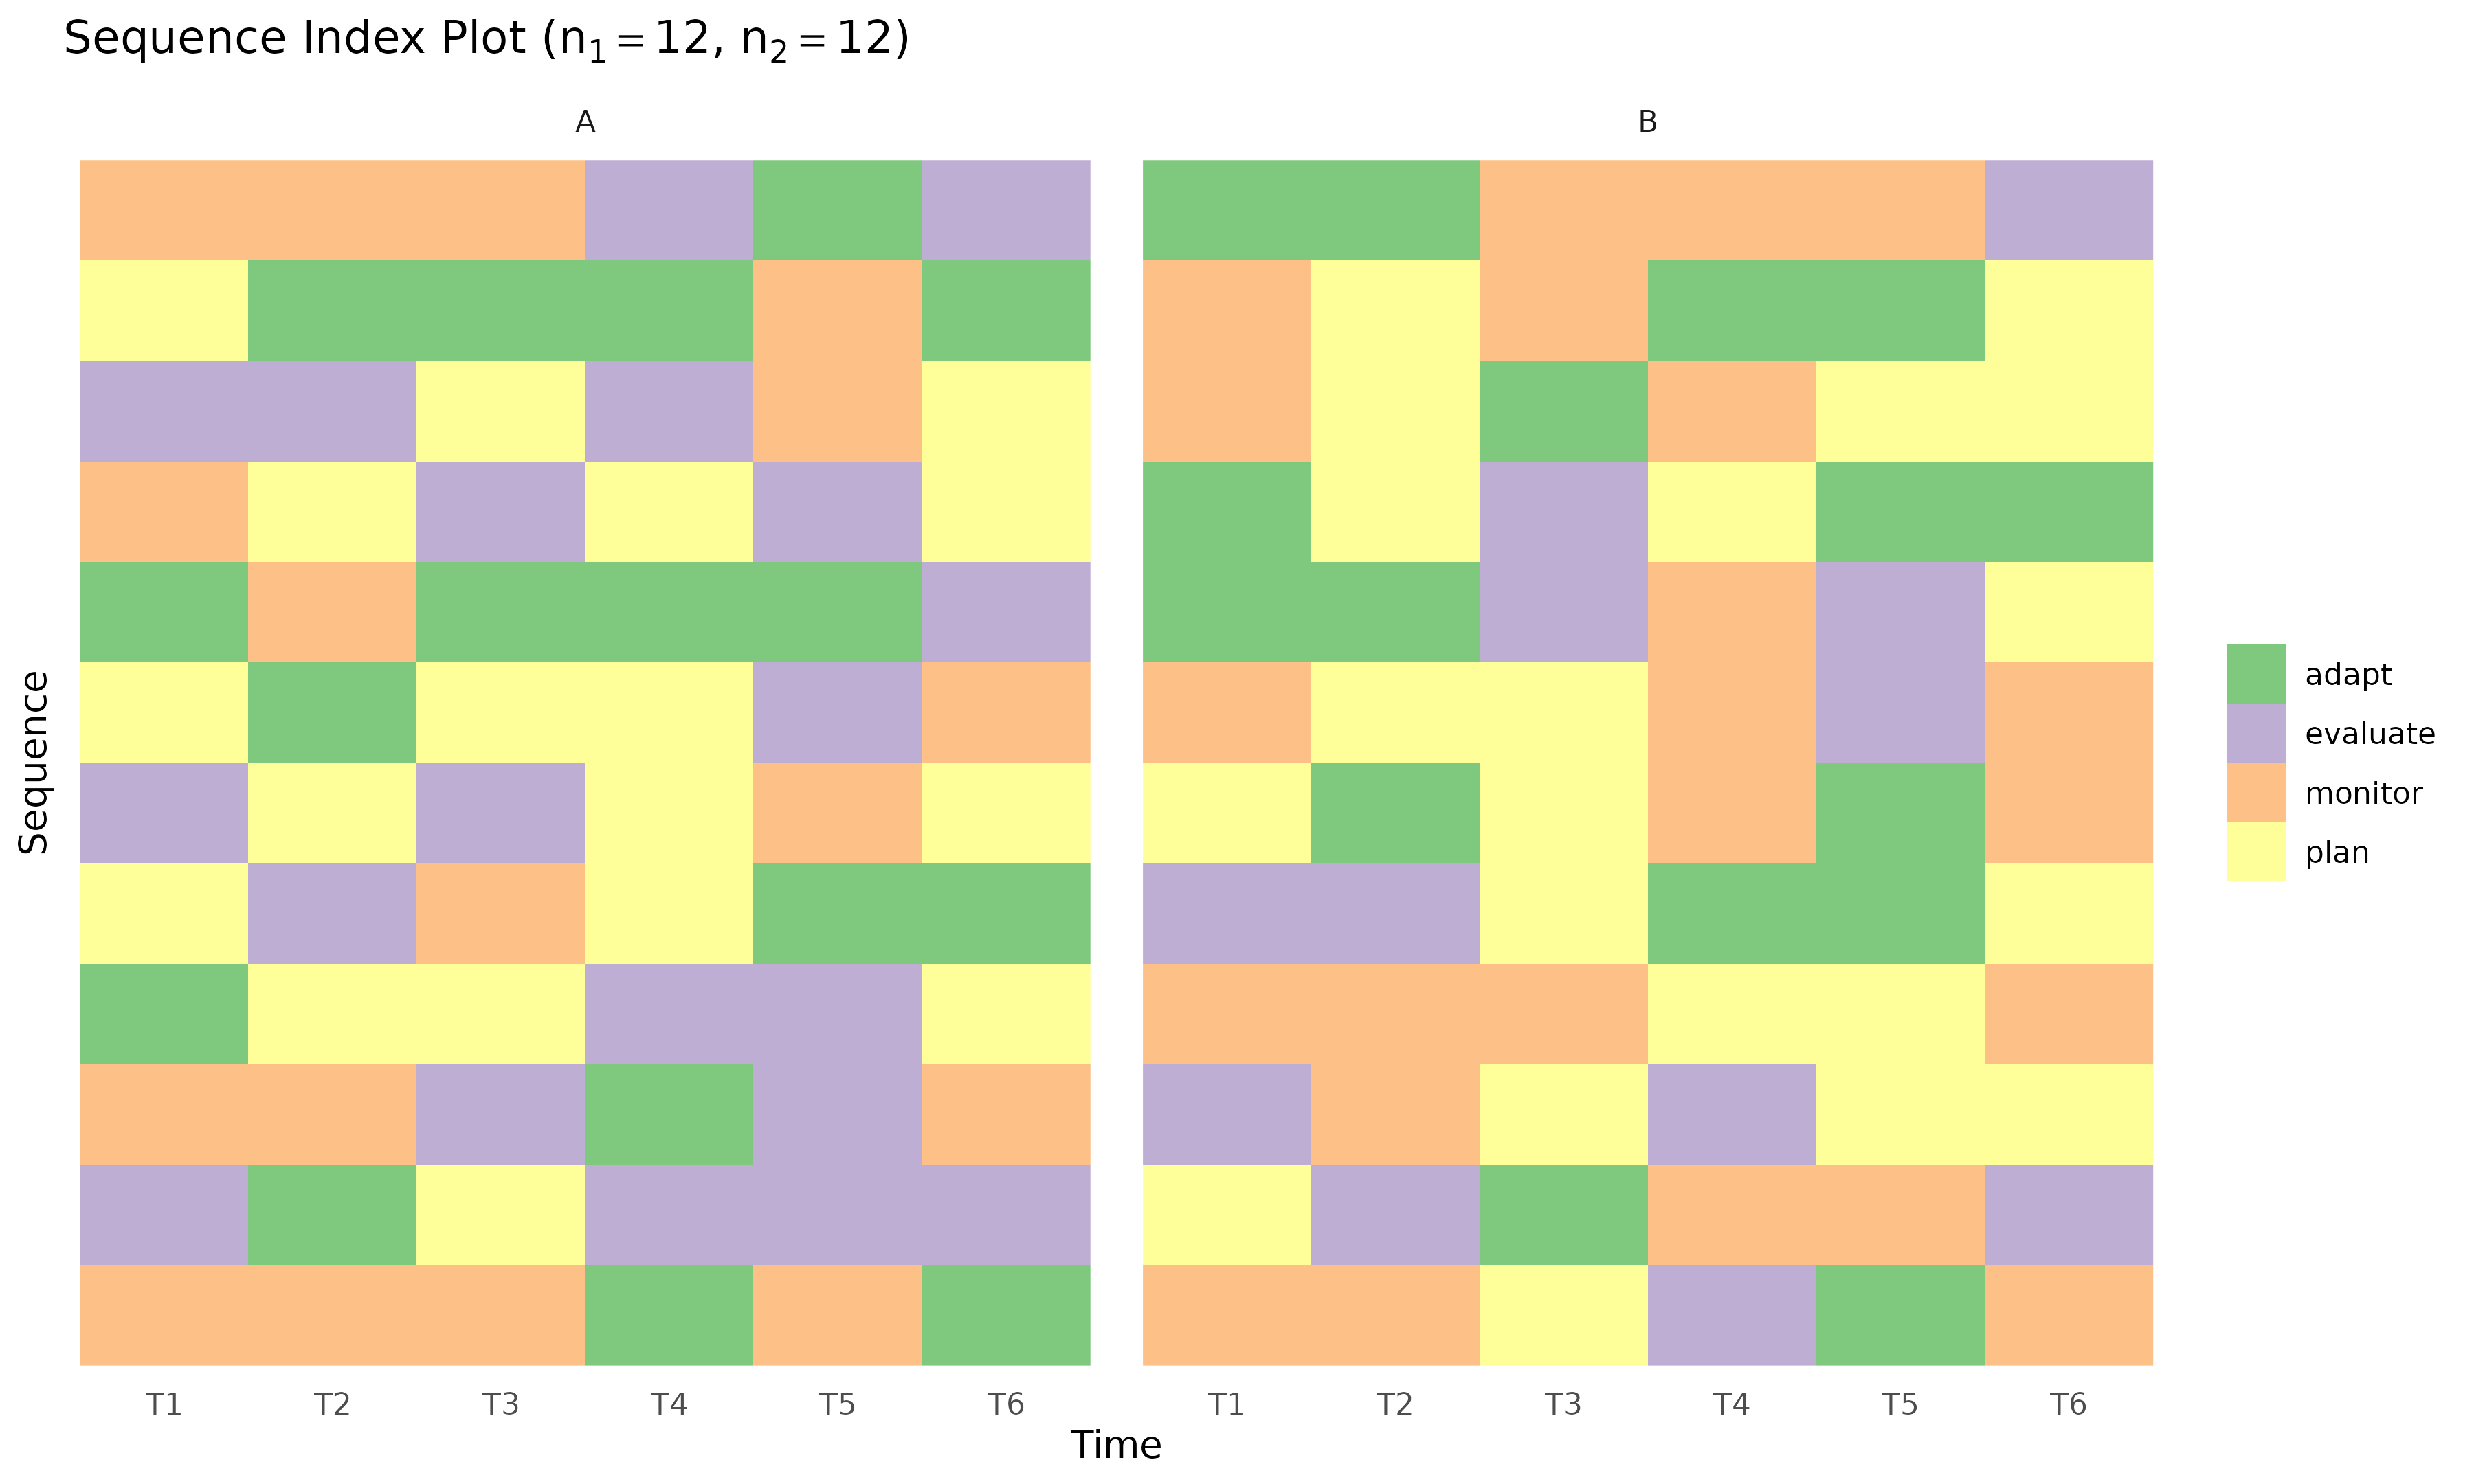
Prepared TNA data
Exercises plot_sequences.tna_data() and metadata-based
grouping.
tna::plot_sequences(
  prepared_data,
  group = "cohort",
  type = "index",
  tick = 1
)
Structural analysis plots
Centralities
Exercises plot.tna_centralities() and
plot.group_tna_centralities().
plot(centrality_result, ncol = 3)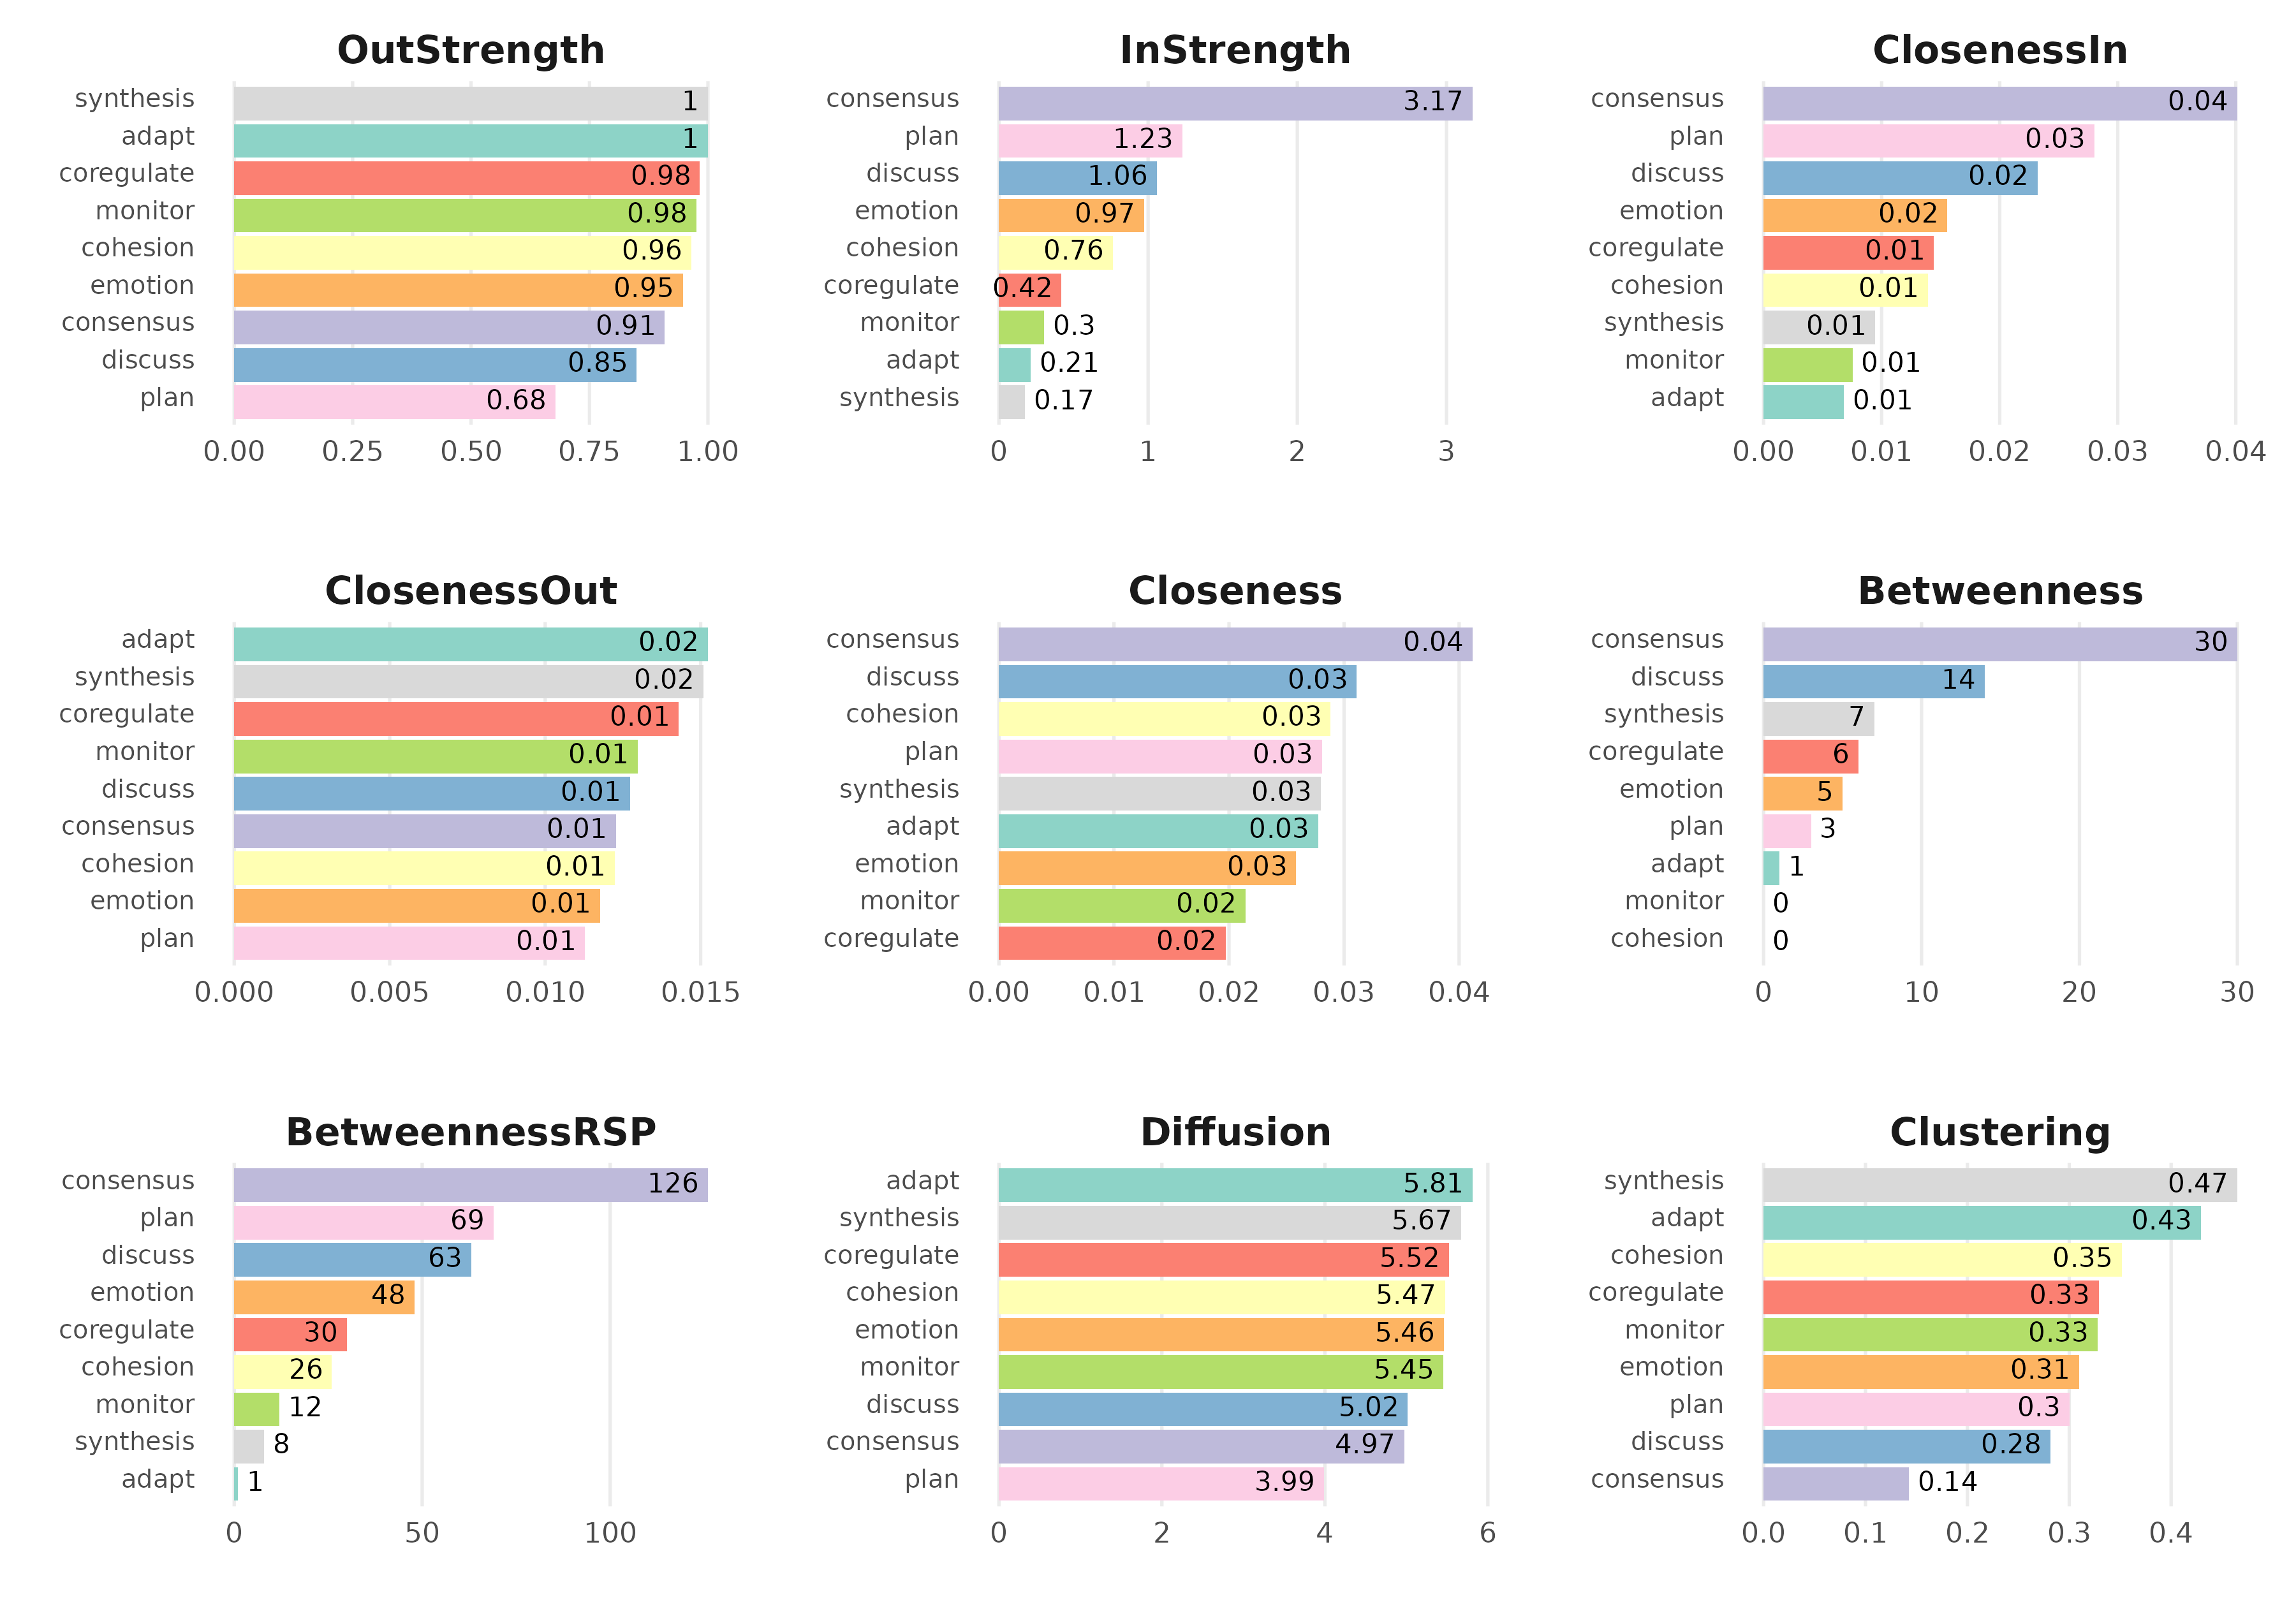
plot(group_centrality_result, ncol = 3)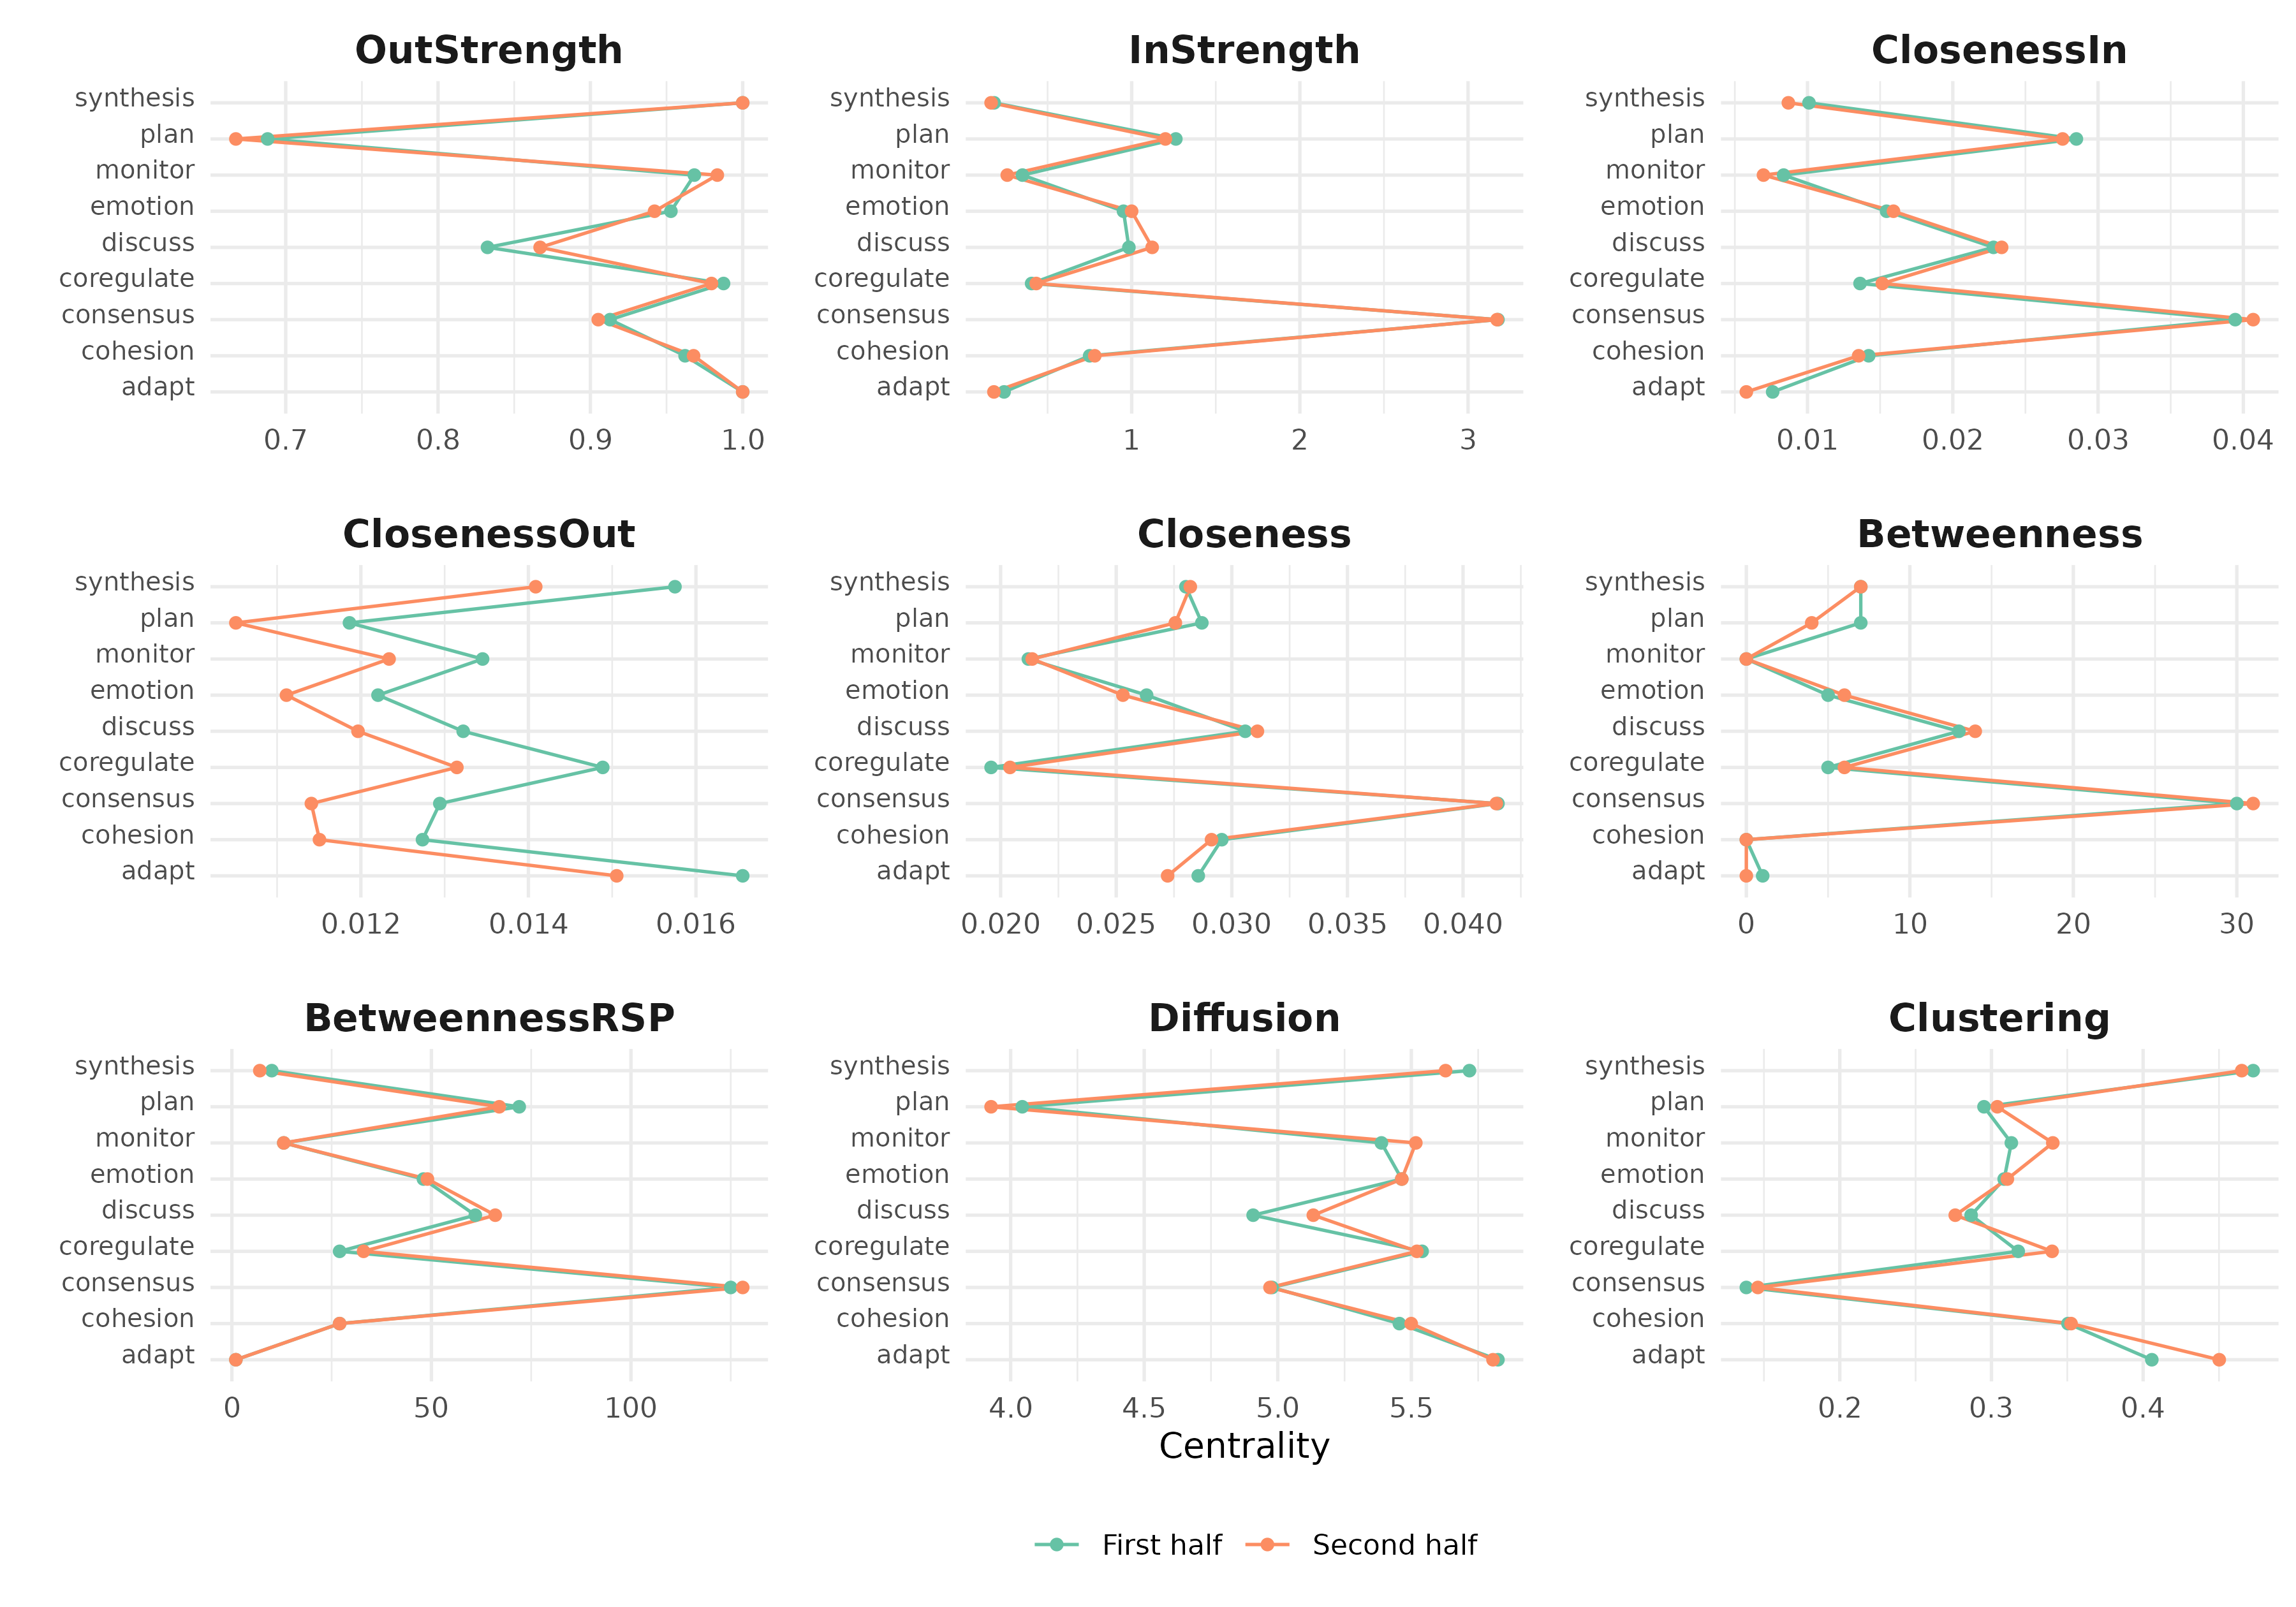
Bootstrap plots
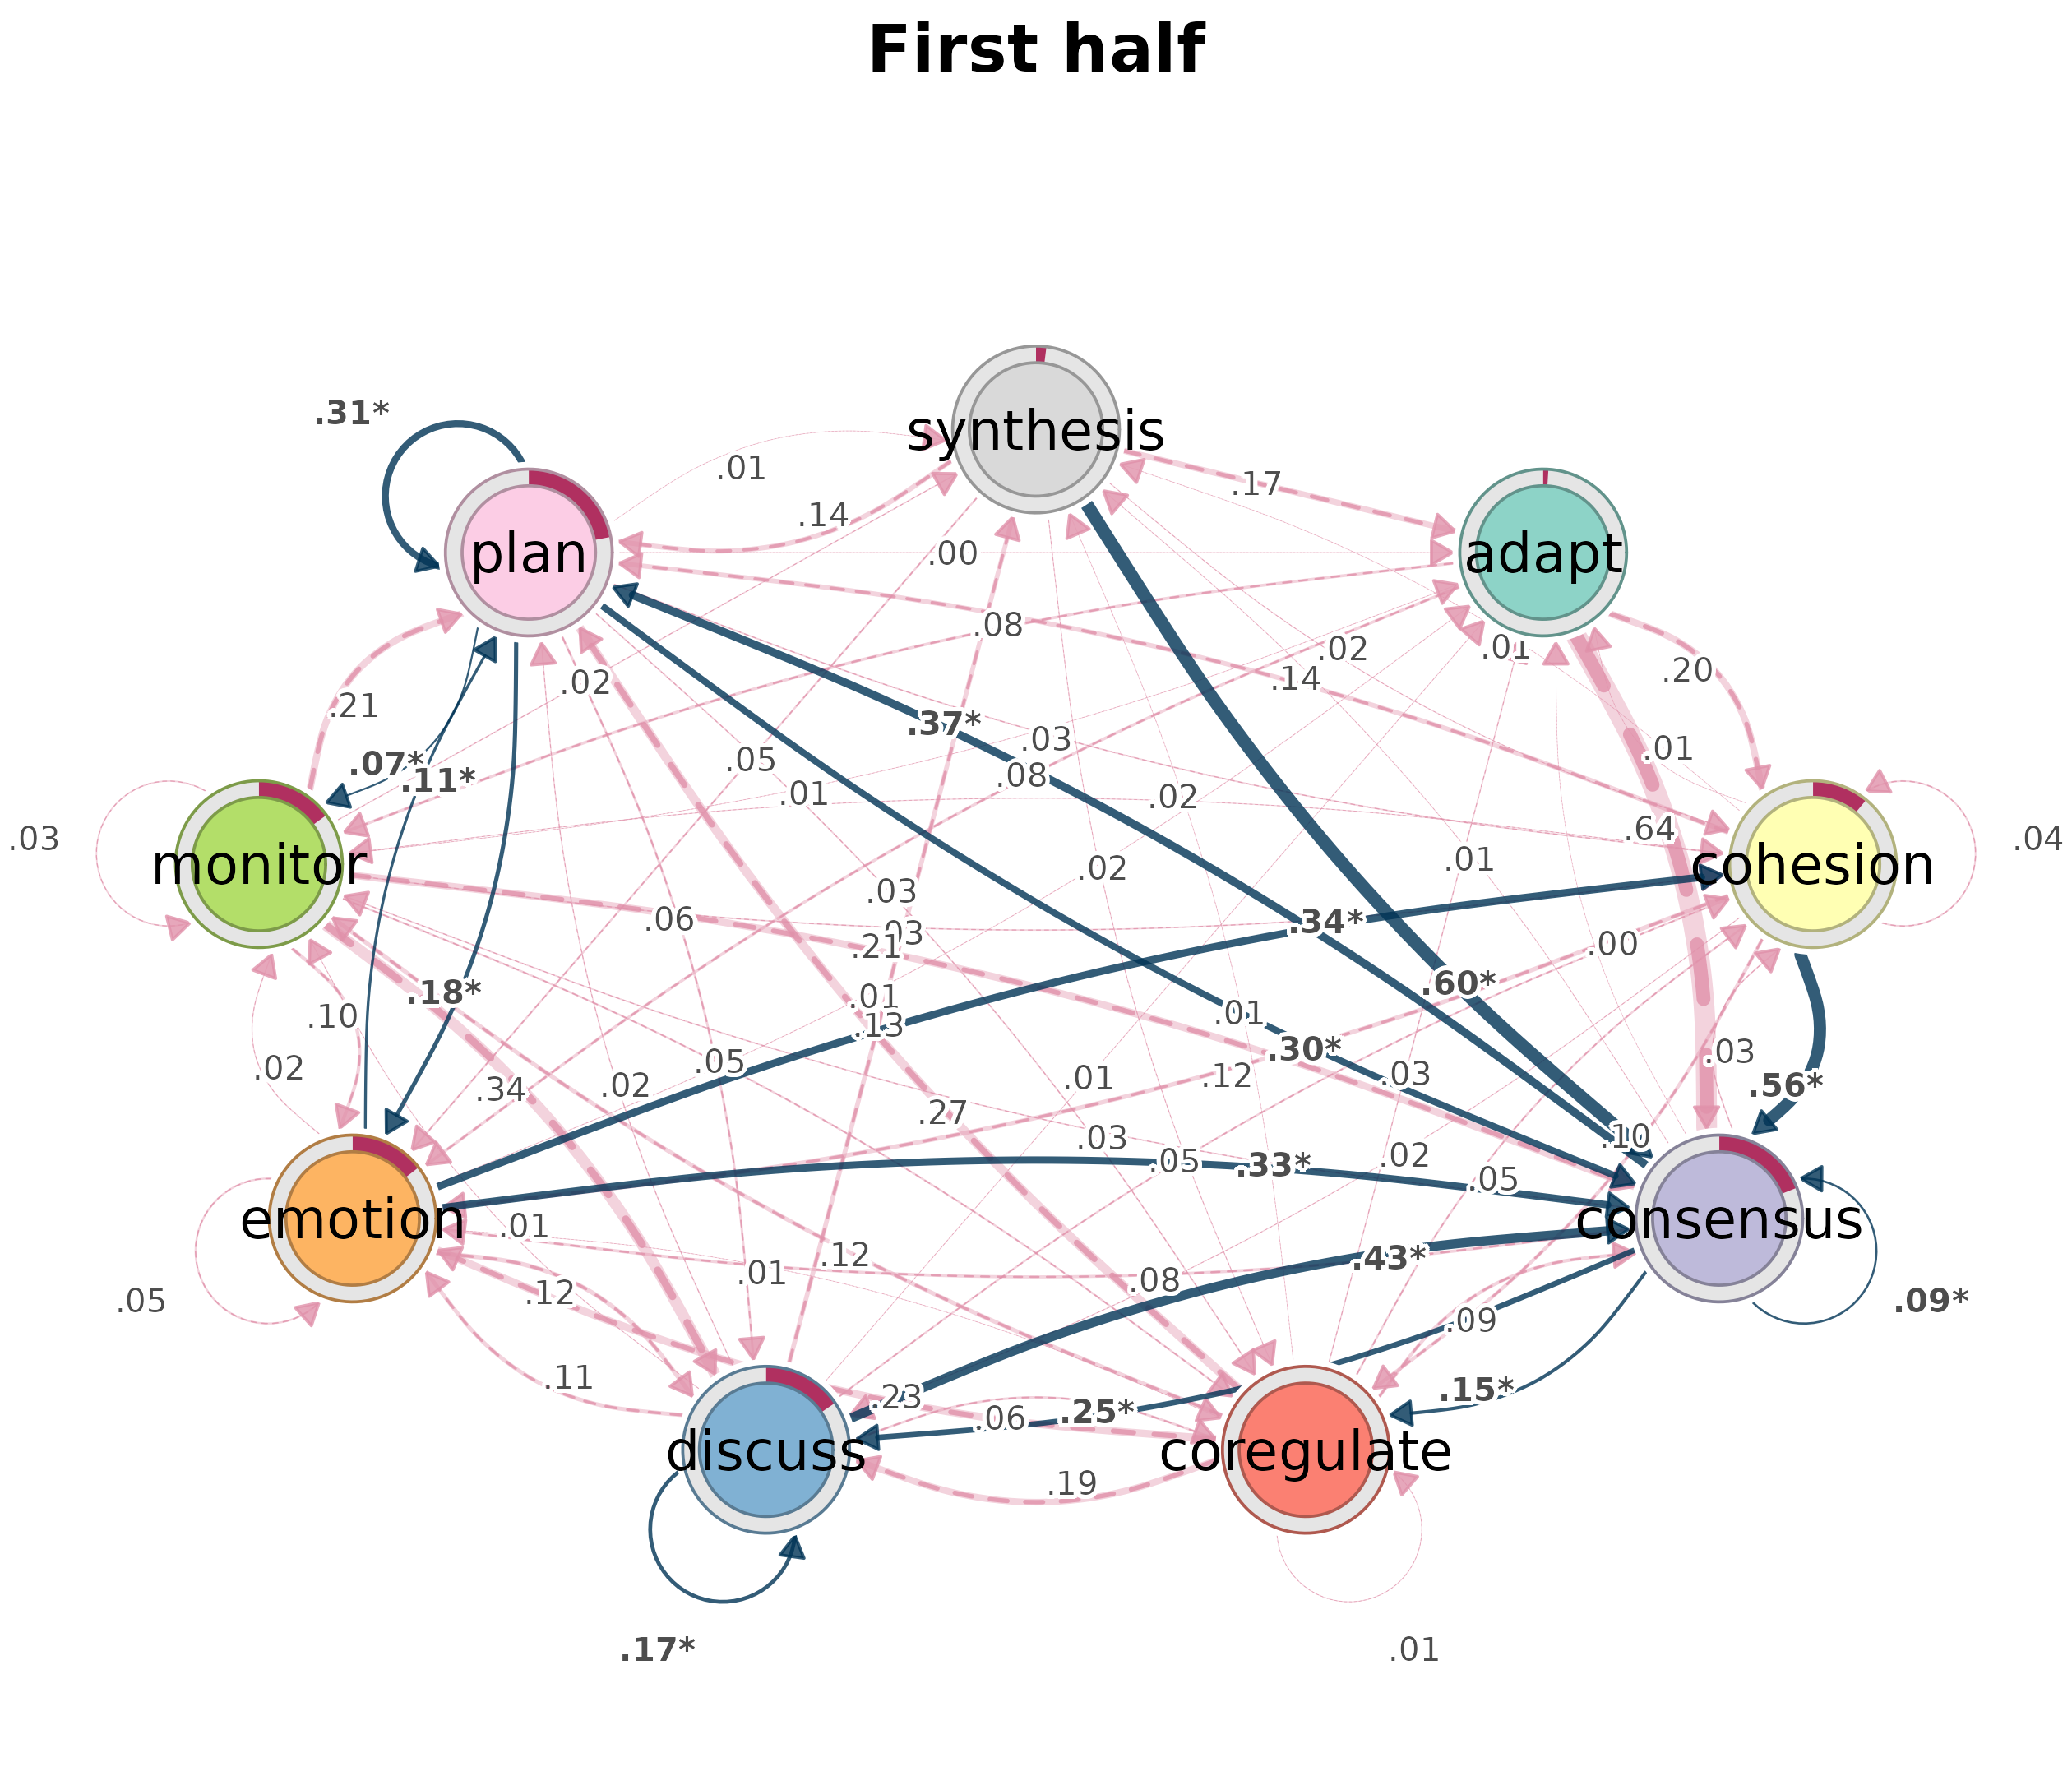
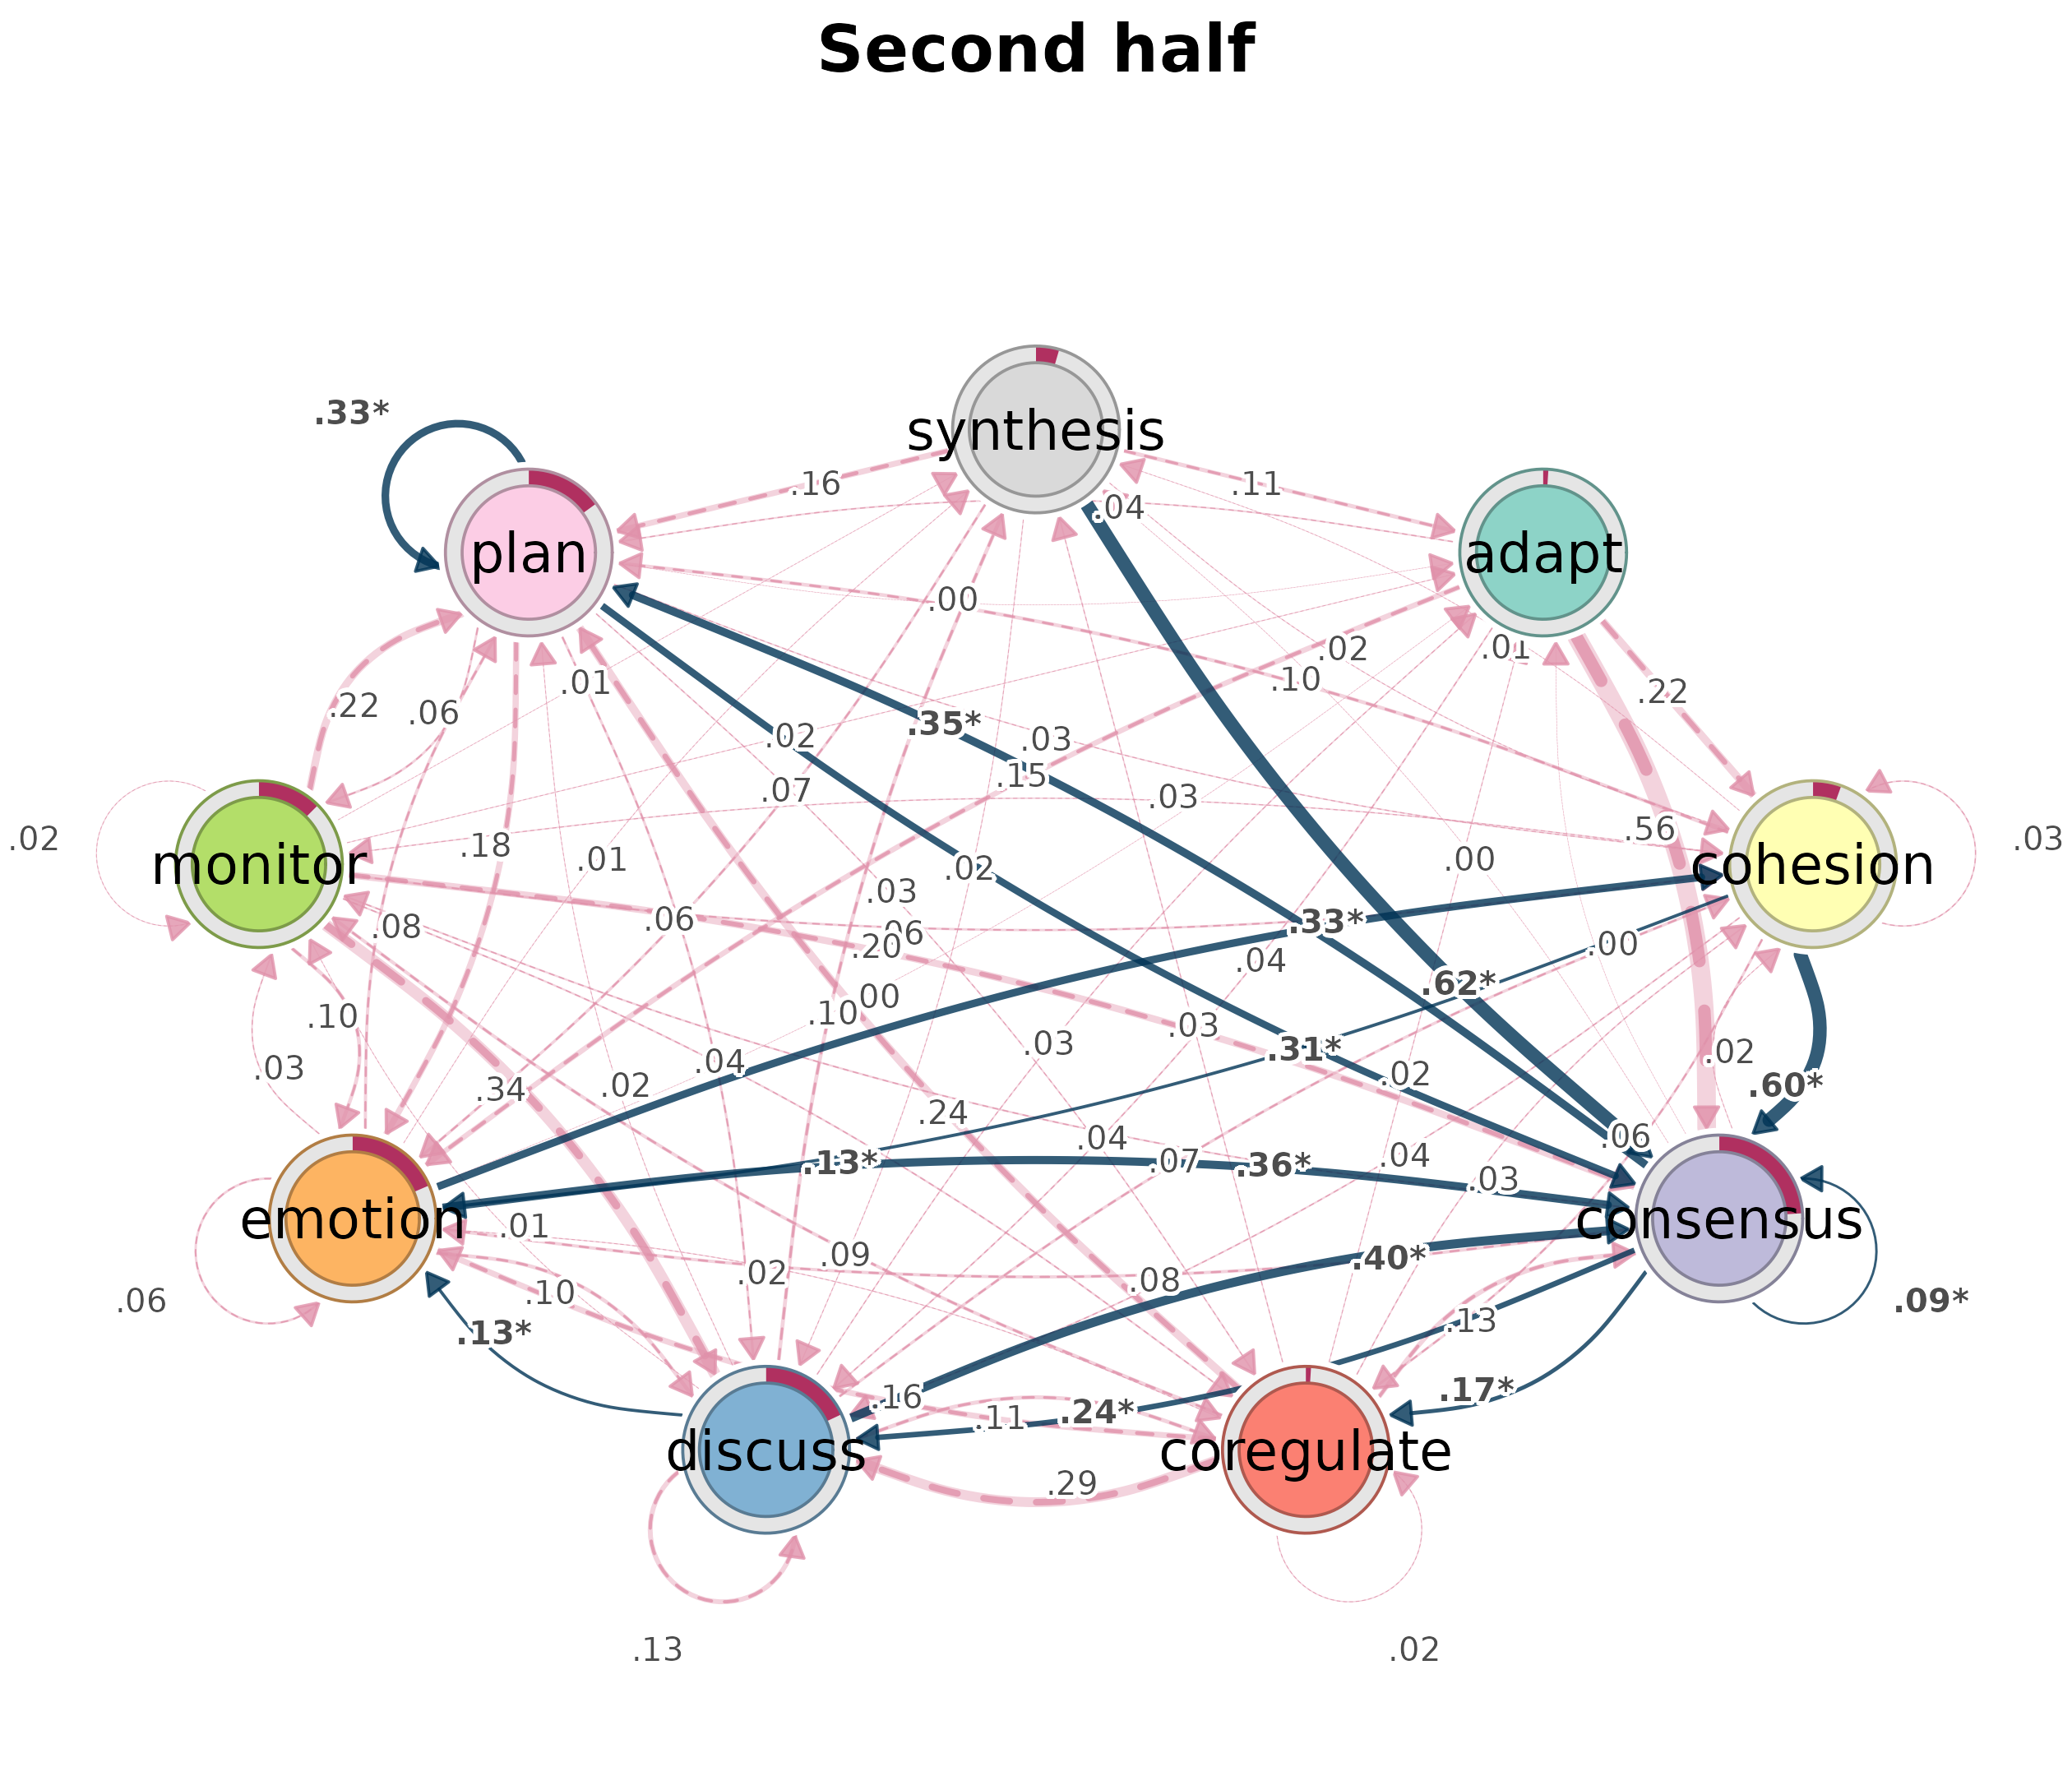
TNA bootstrap method
Exercises plot.tna_bootstrap().
plot(bootstrap_result, title = "TNA bootstrap")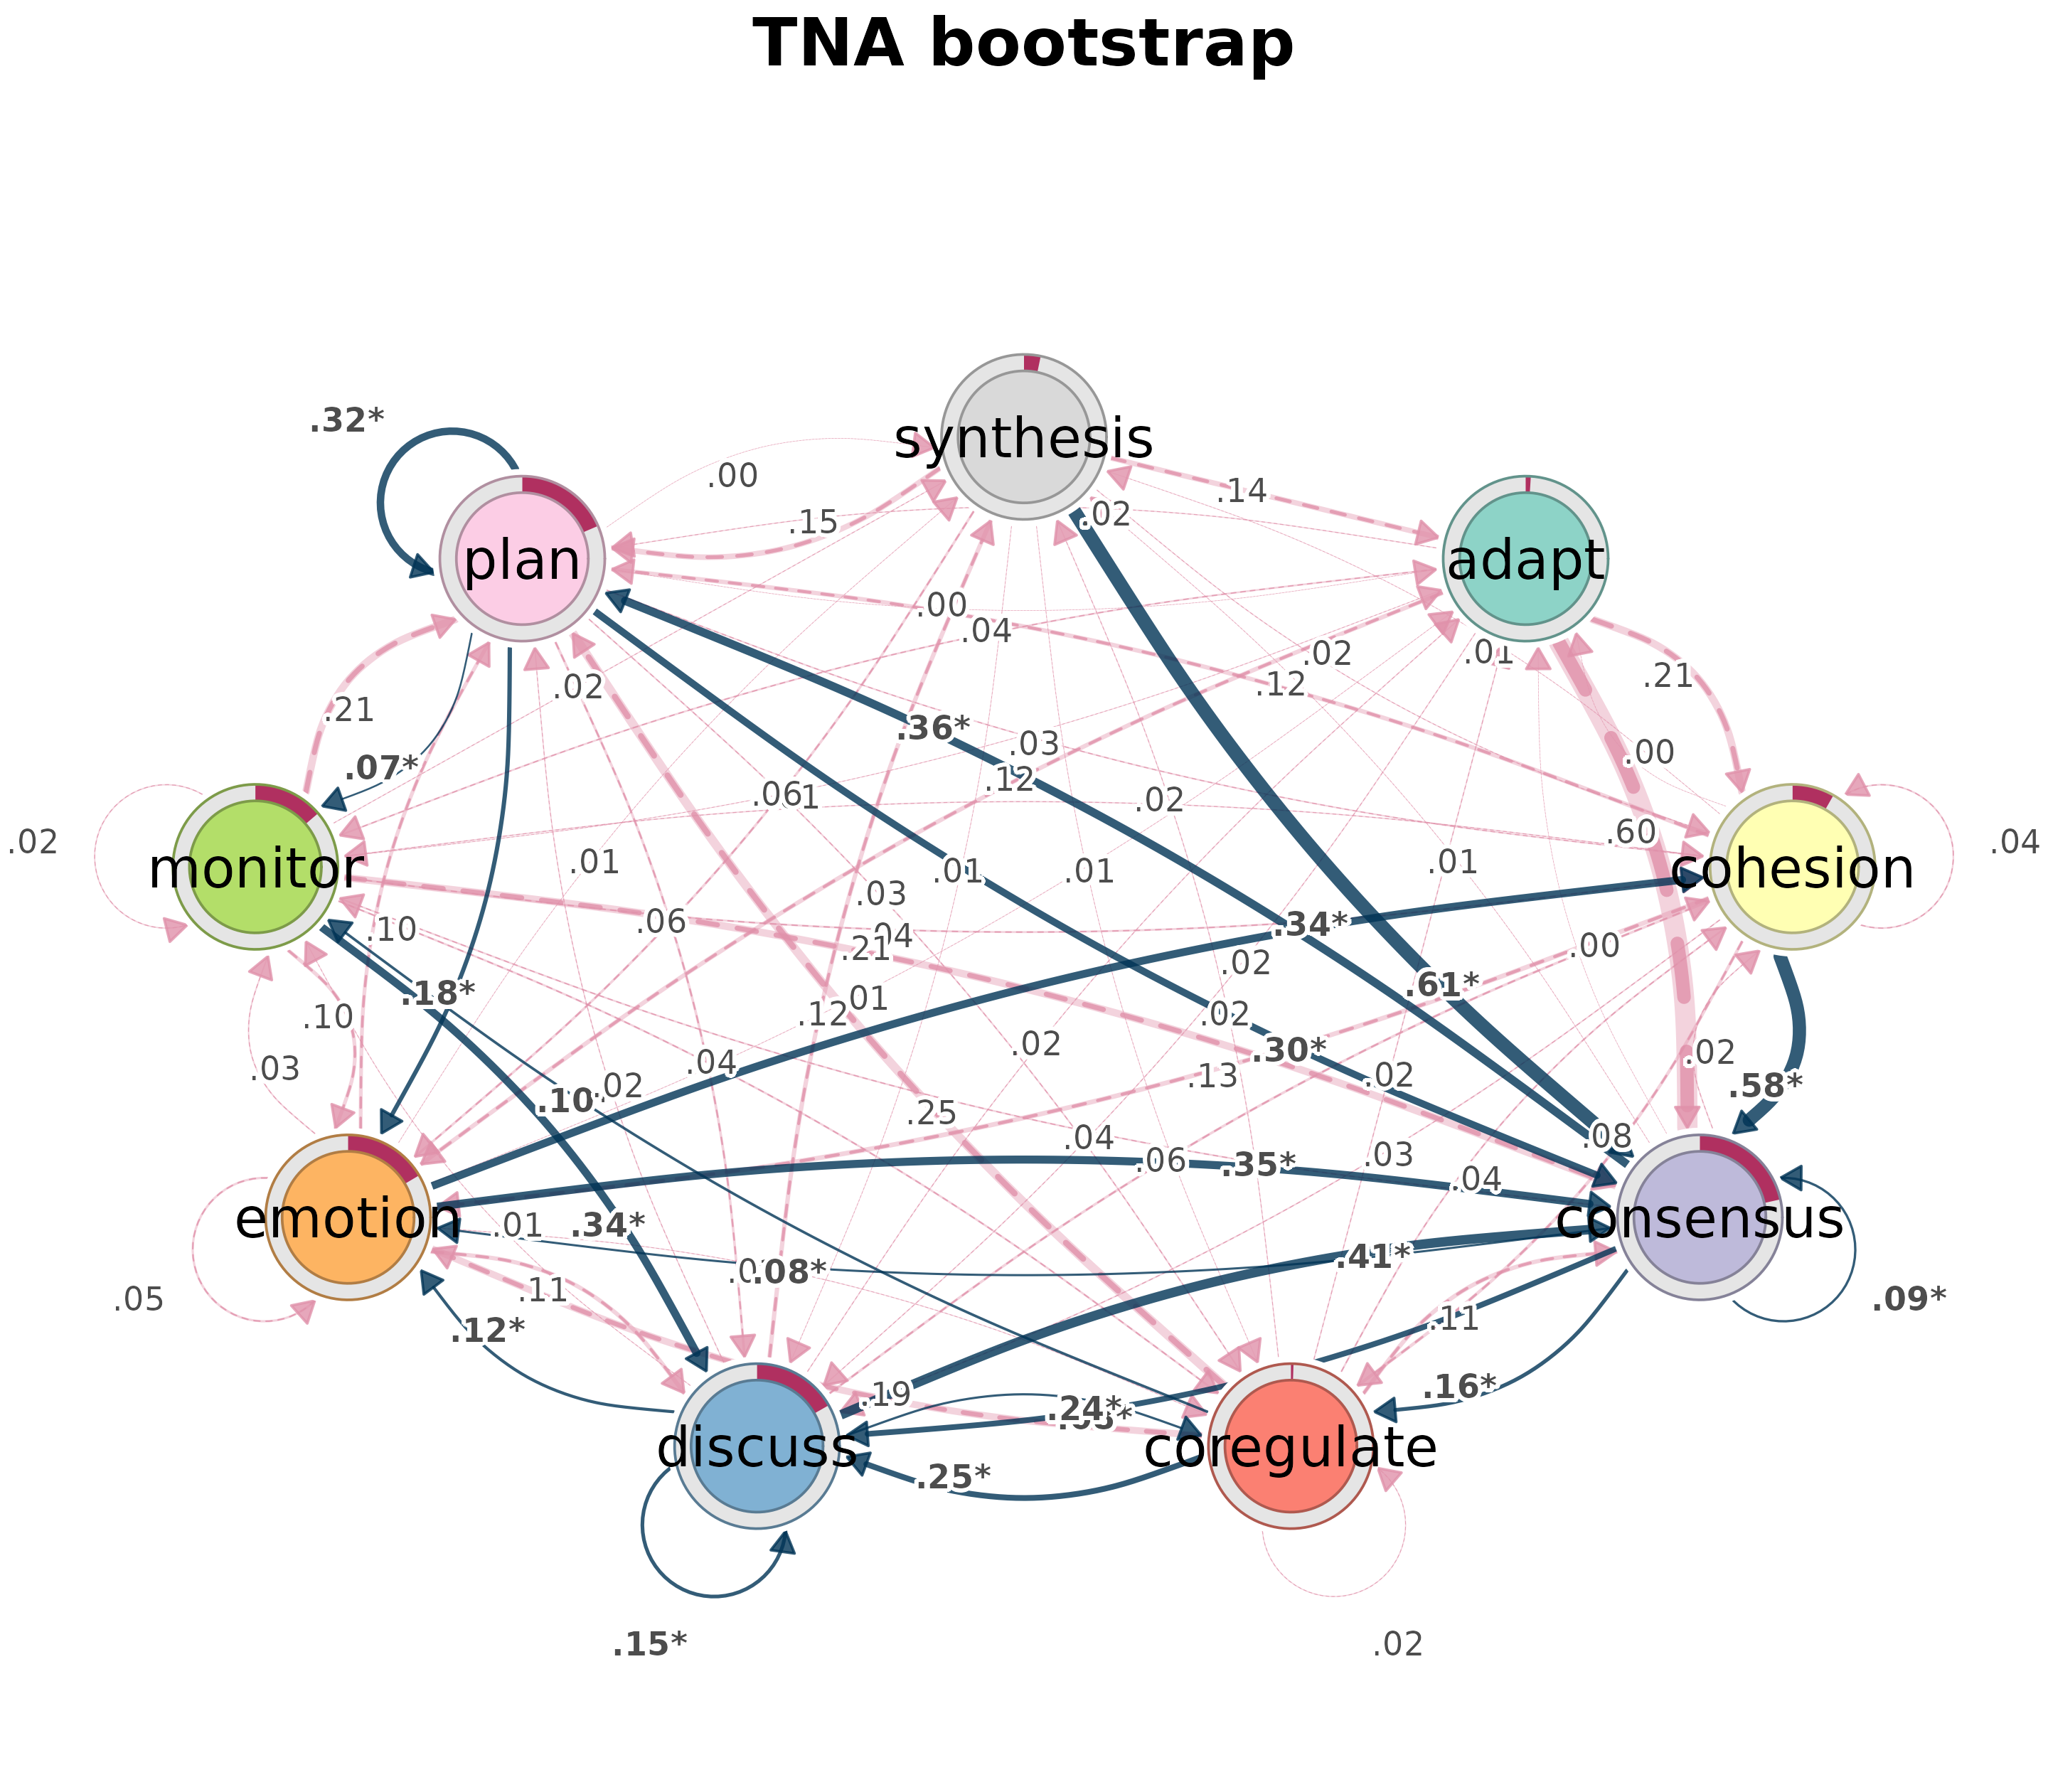
Cograph bootstrap render modes
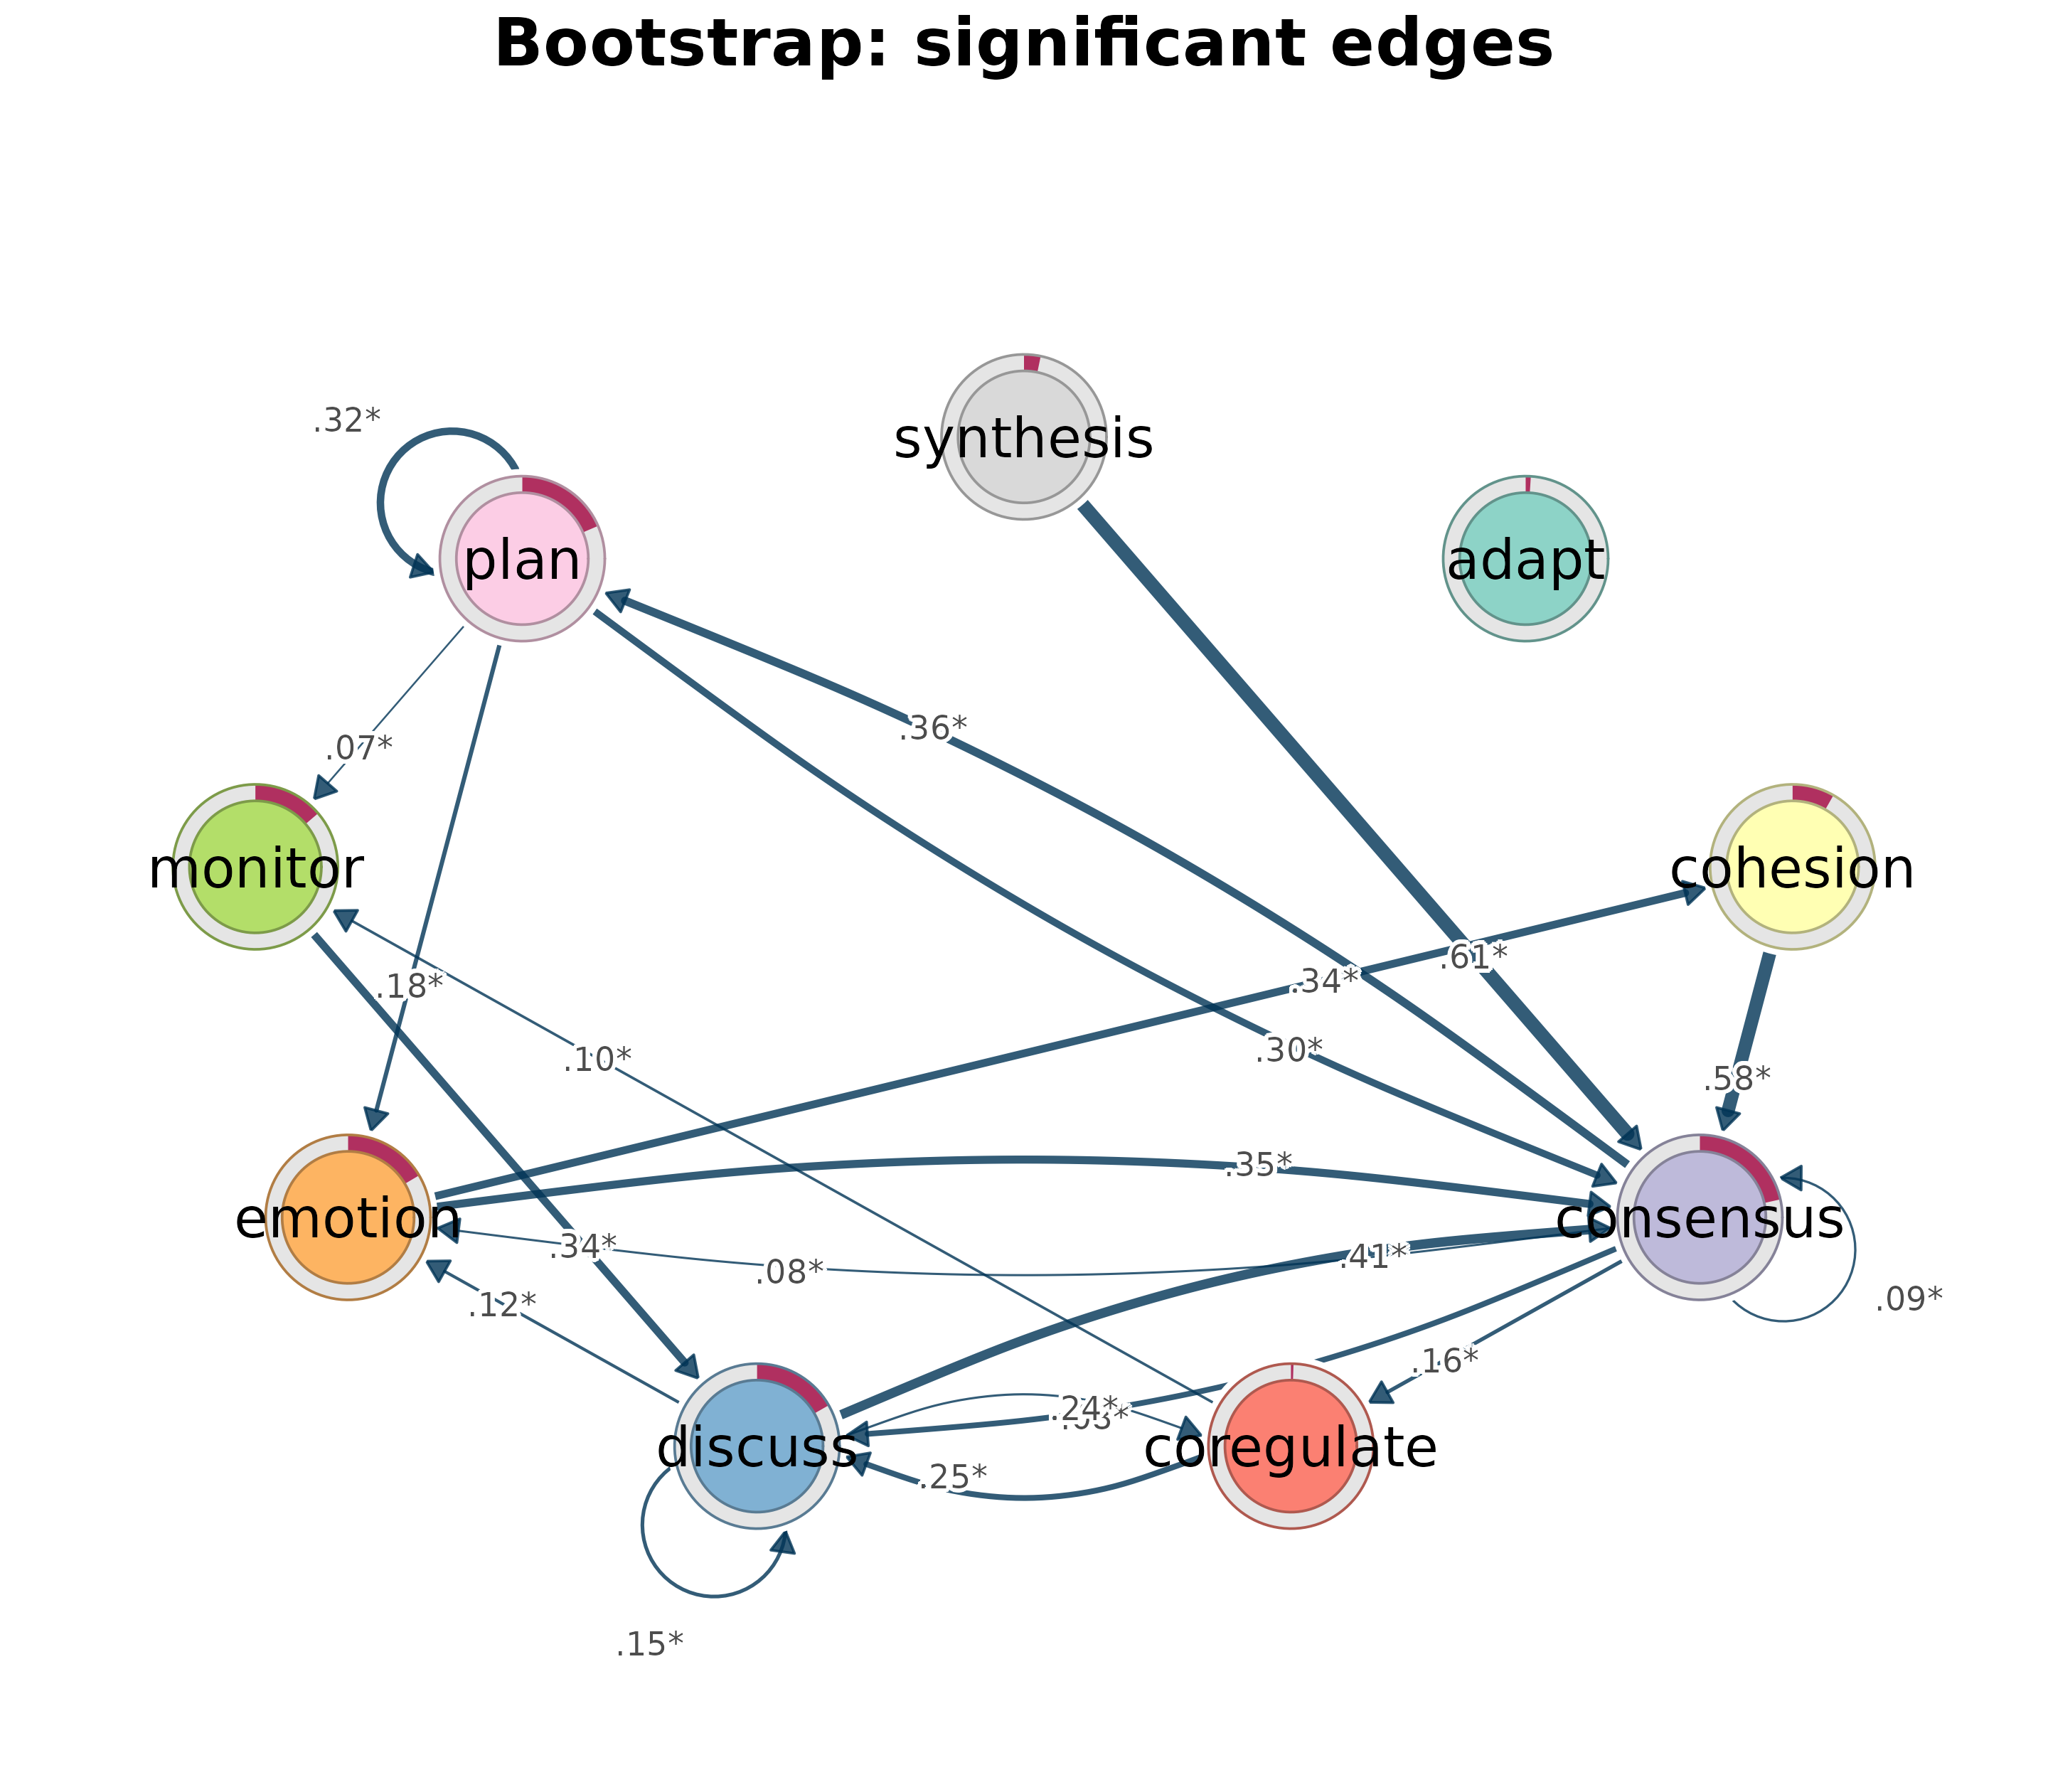
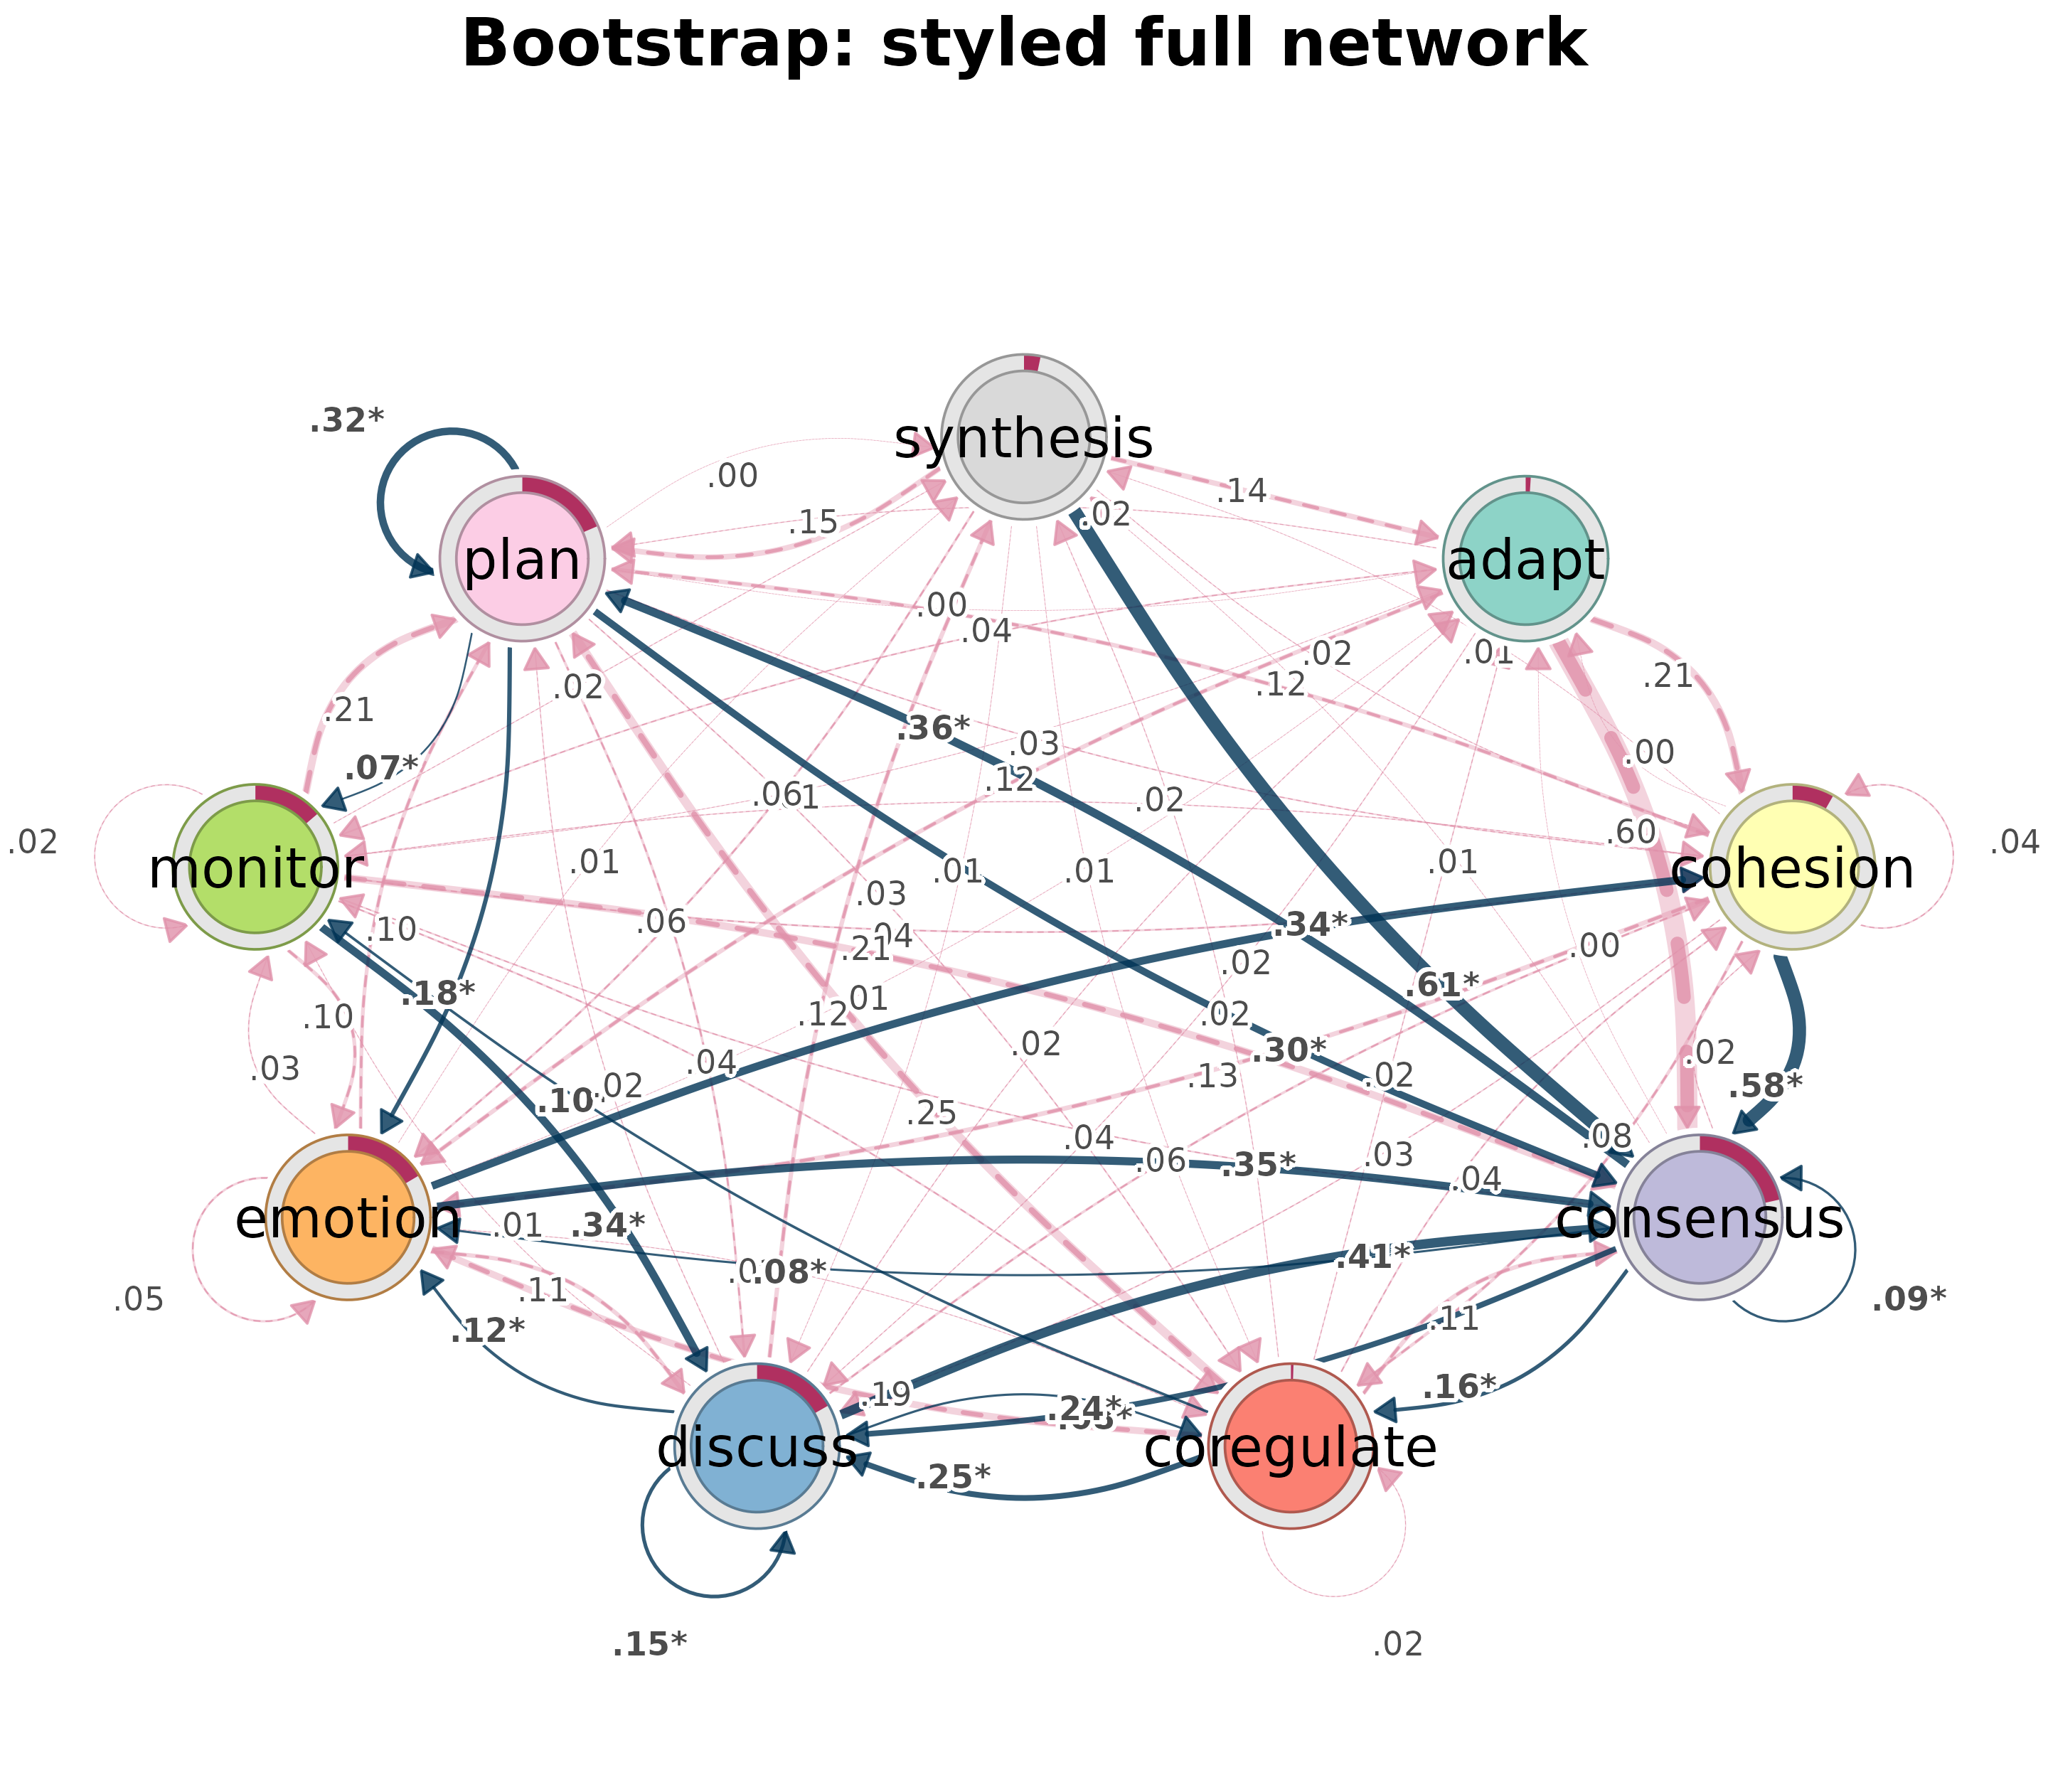
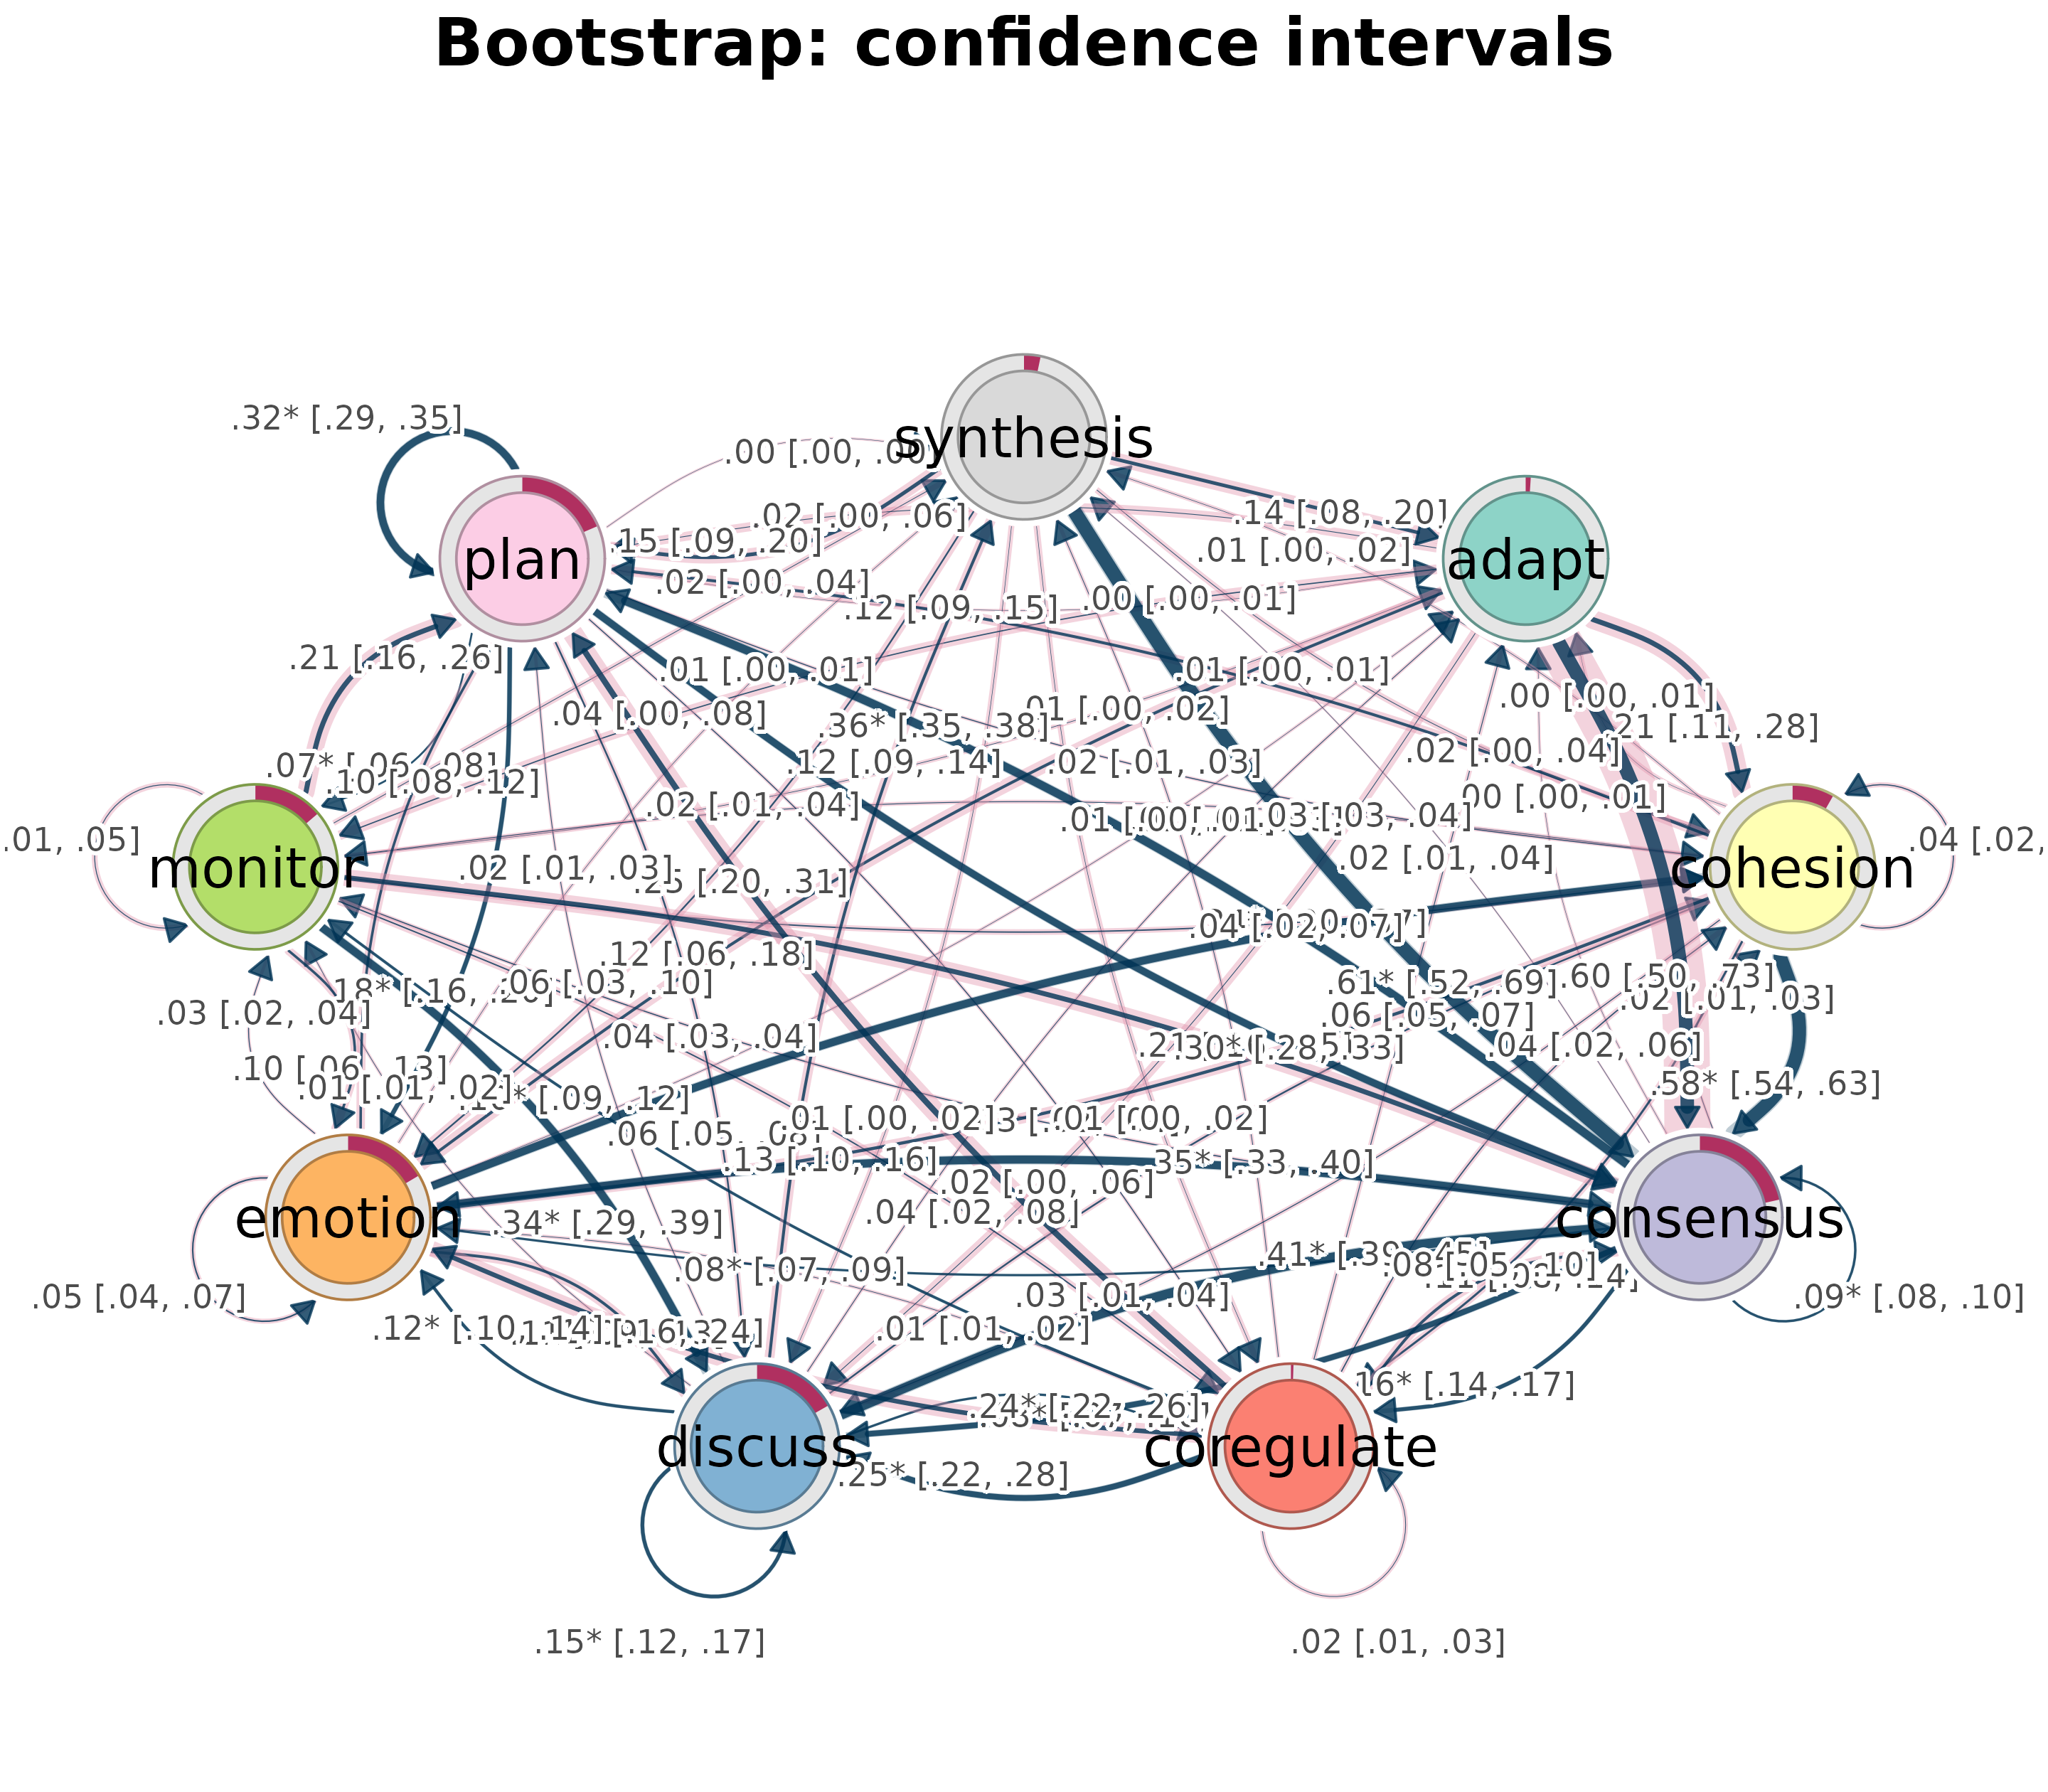
These plots verify all enhanced splot.tna_bootstrap()
display modes.
cograph::splot(
  bootstrap_result,
  display = "significant",
  title = "Bootstrap: significant edges",
  show_stars = TRUE
)
cograph::splot(
  bootstrap_result,
  display = "styled",
  title = "Bootstrap: styled full network",
  show_stars = TRUE
)
cograph::splot(
  bootstrap_result,
  display = "ci",
  title = "Bootstrap: confidence intervals",
  show_ci = TRUE
)
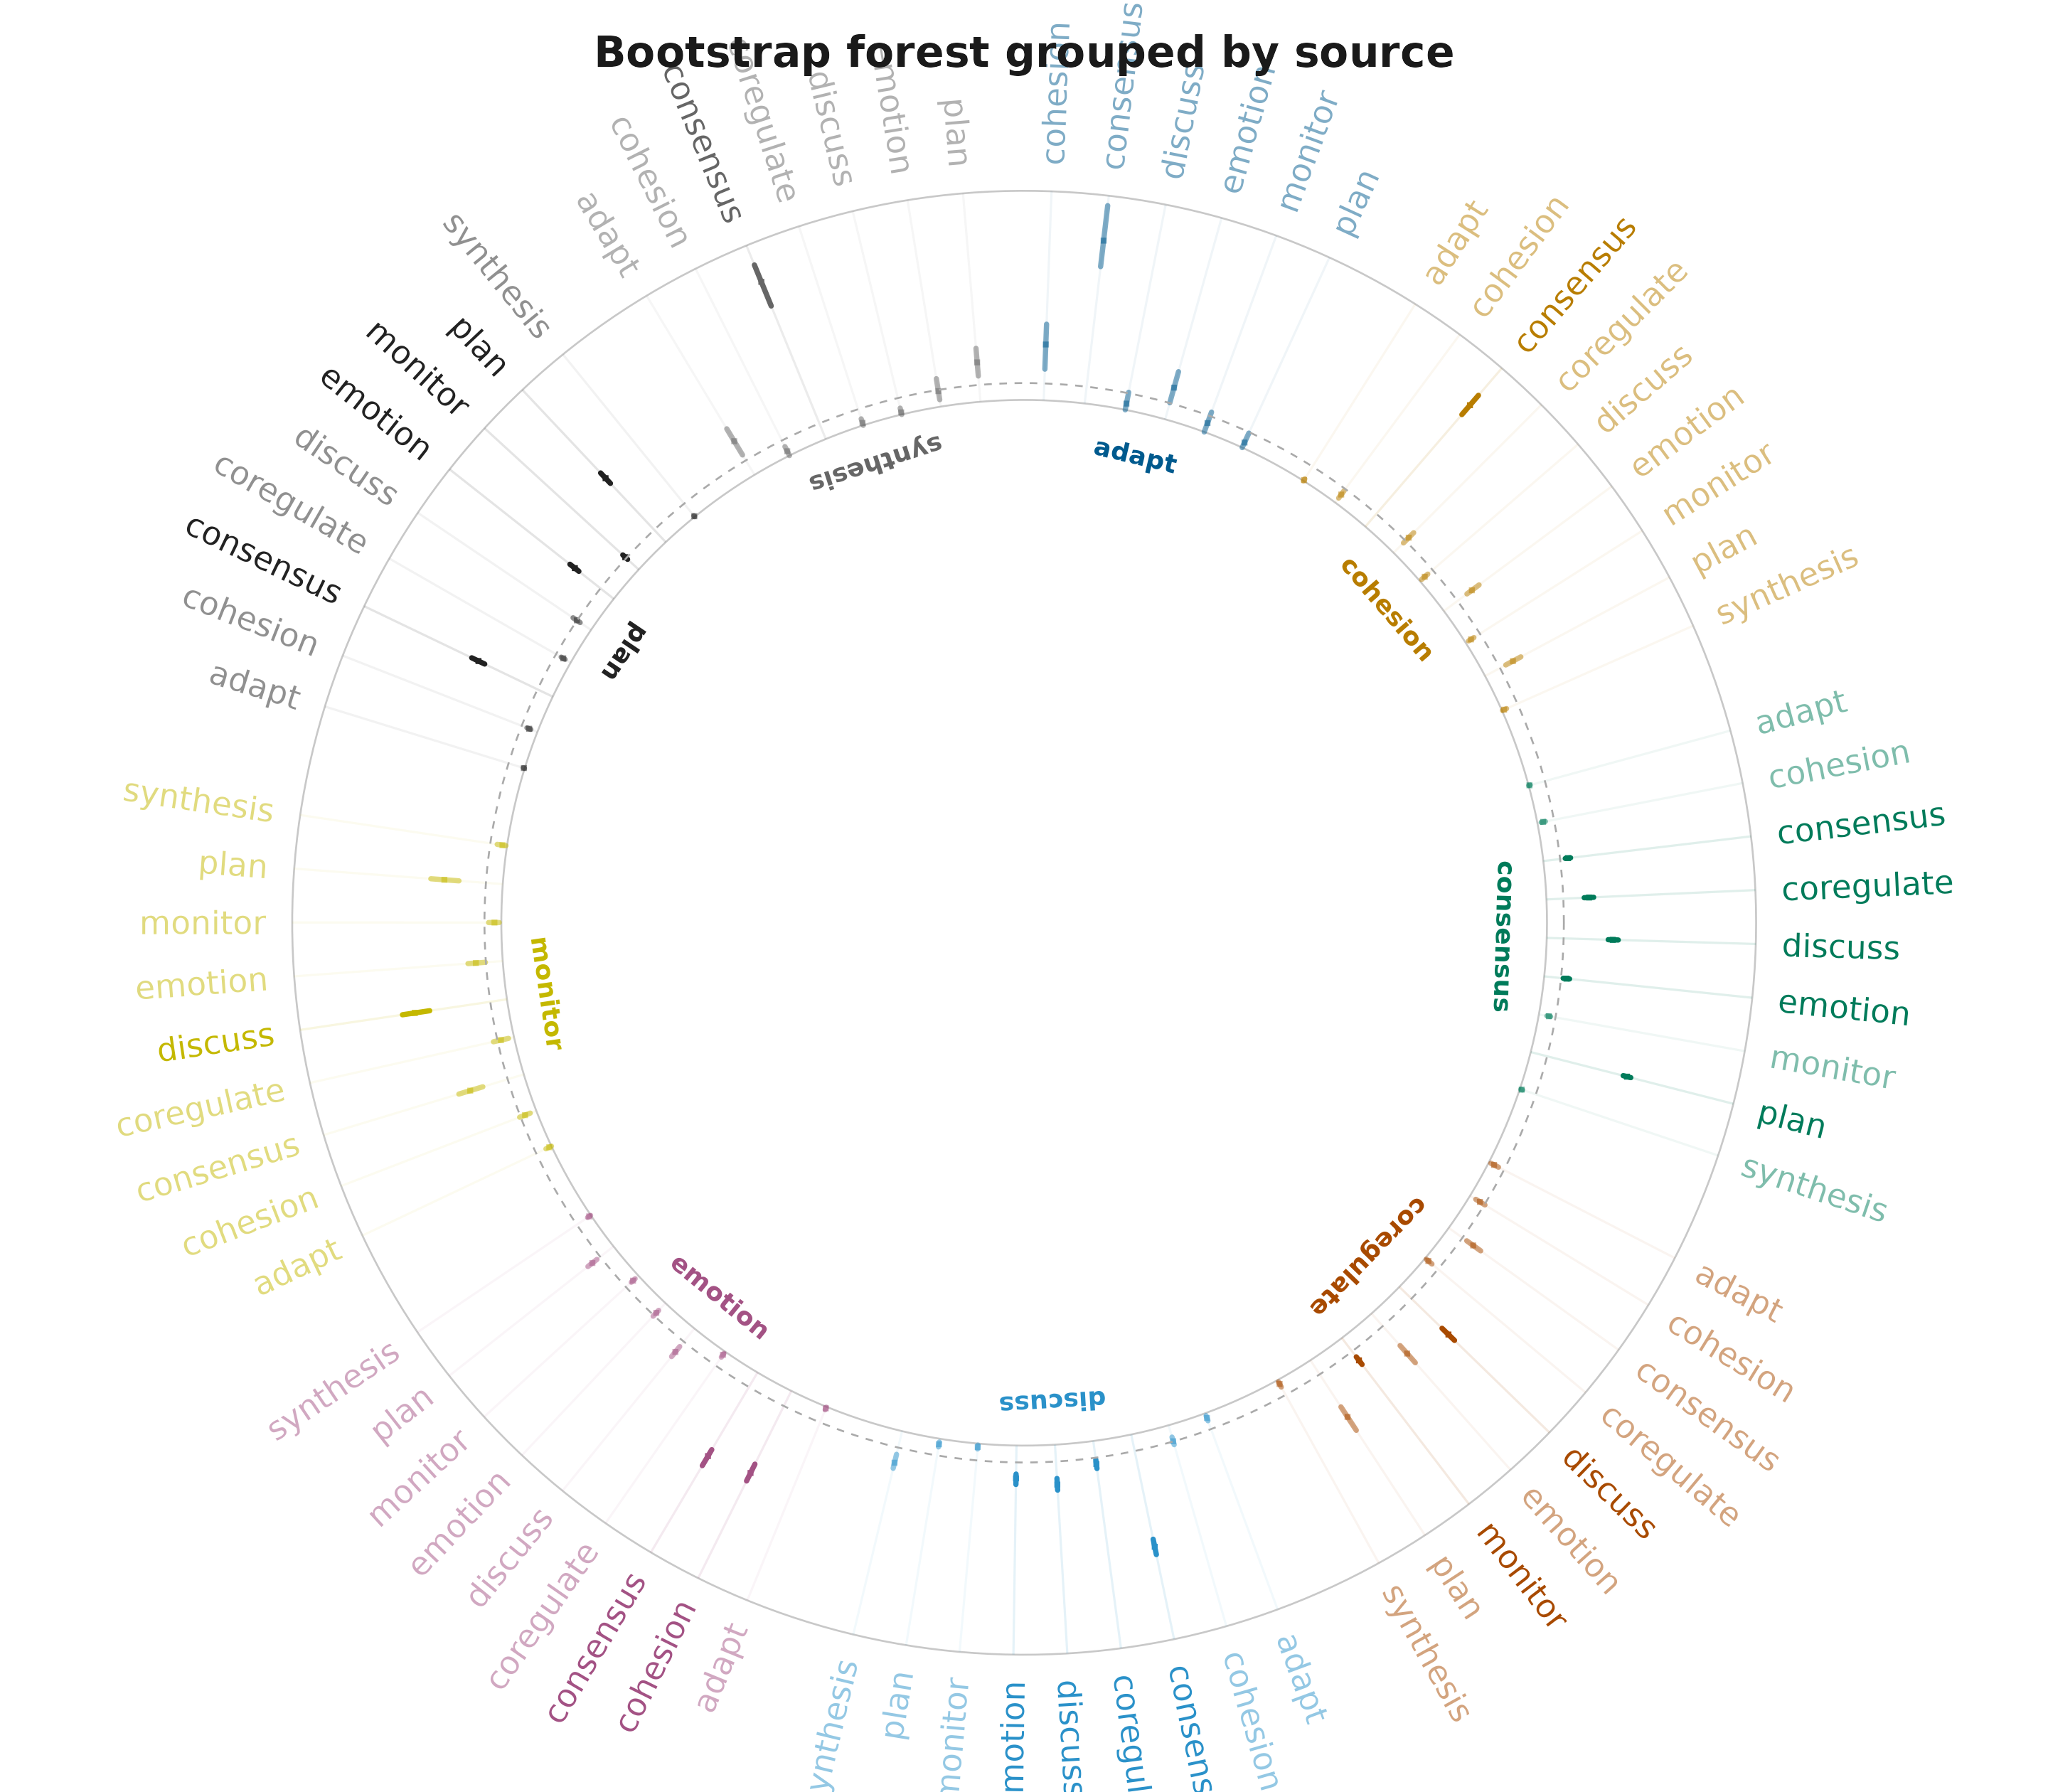
cograph::plot_bootstrap_forest(
  bootstrap_result,
  layout = "grouped",
  title = "Bootstrap forest grouped by source"
)
Permutation plots
TNA permutation method
Exercises plot.tna_permutation().
plot(permutation_result, title = "TNA permutation differences")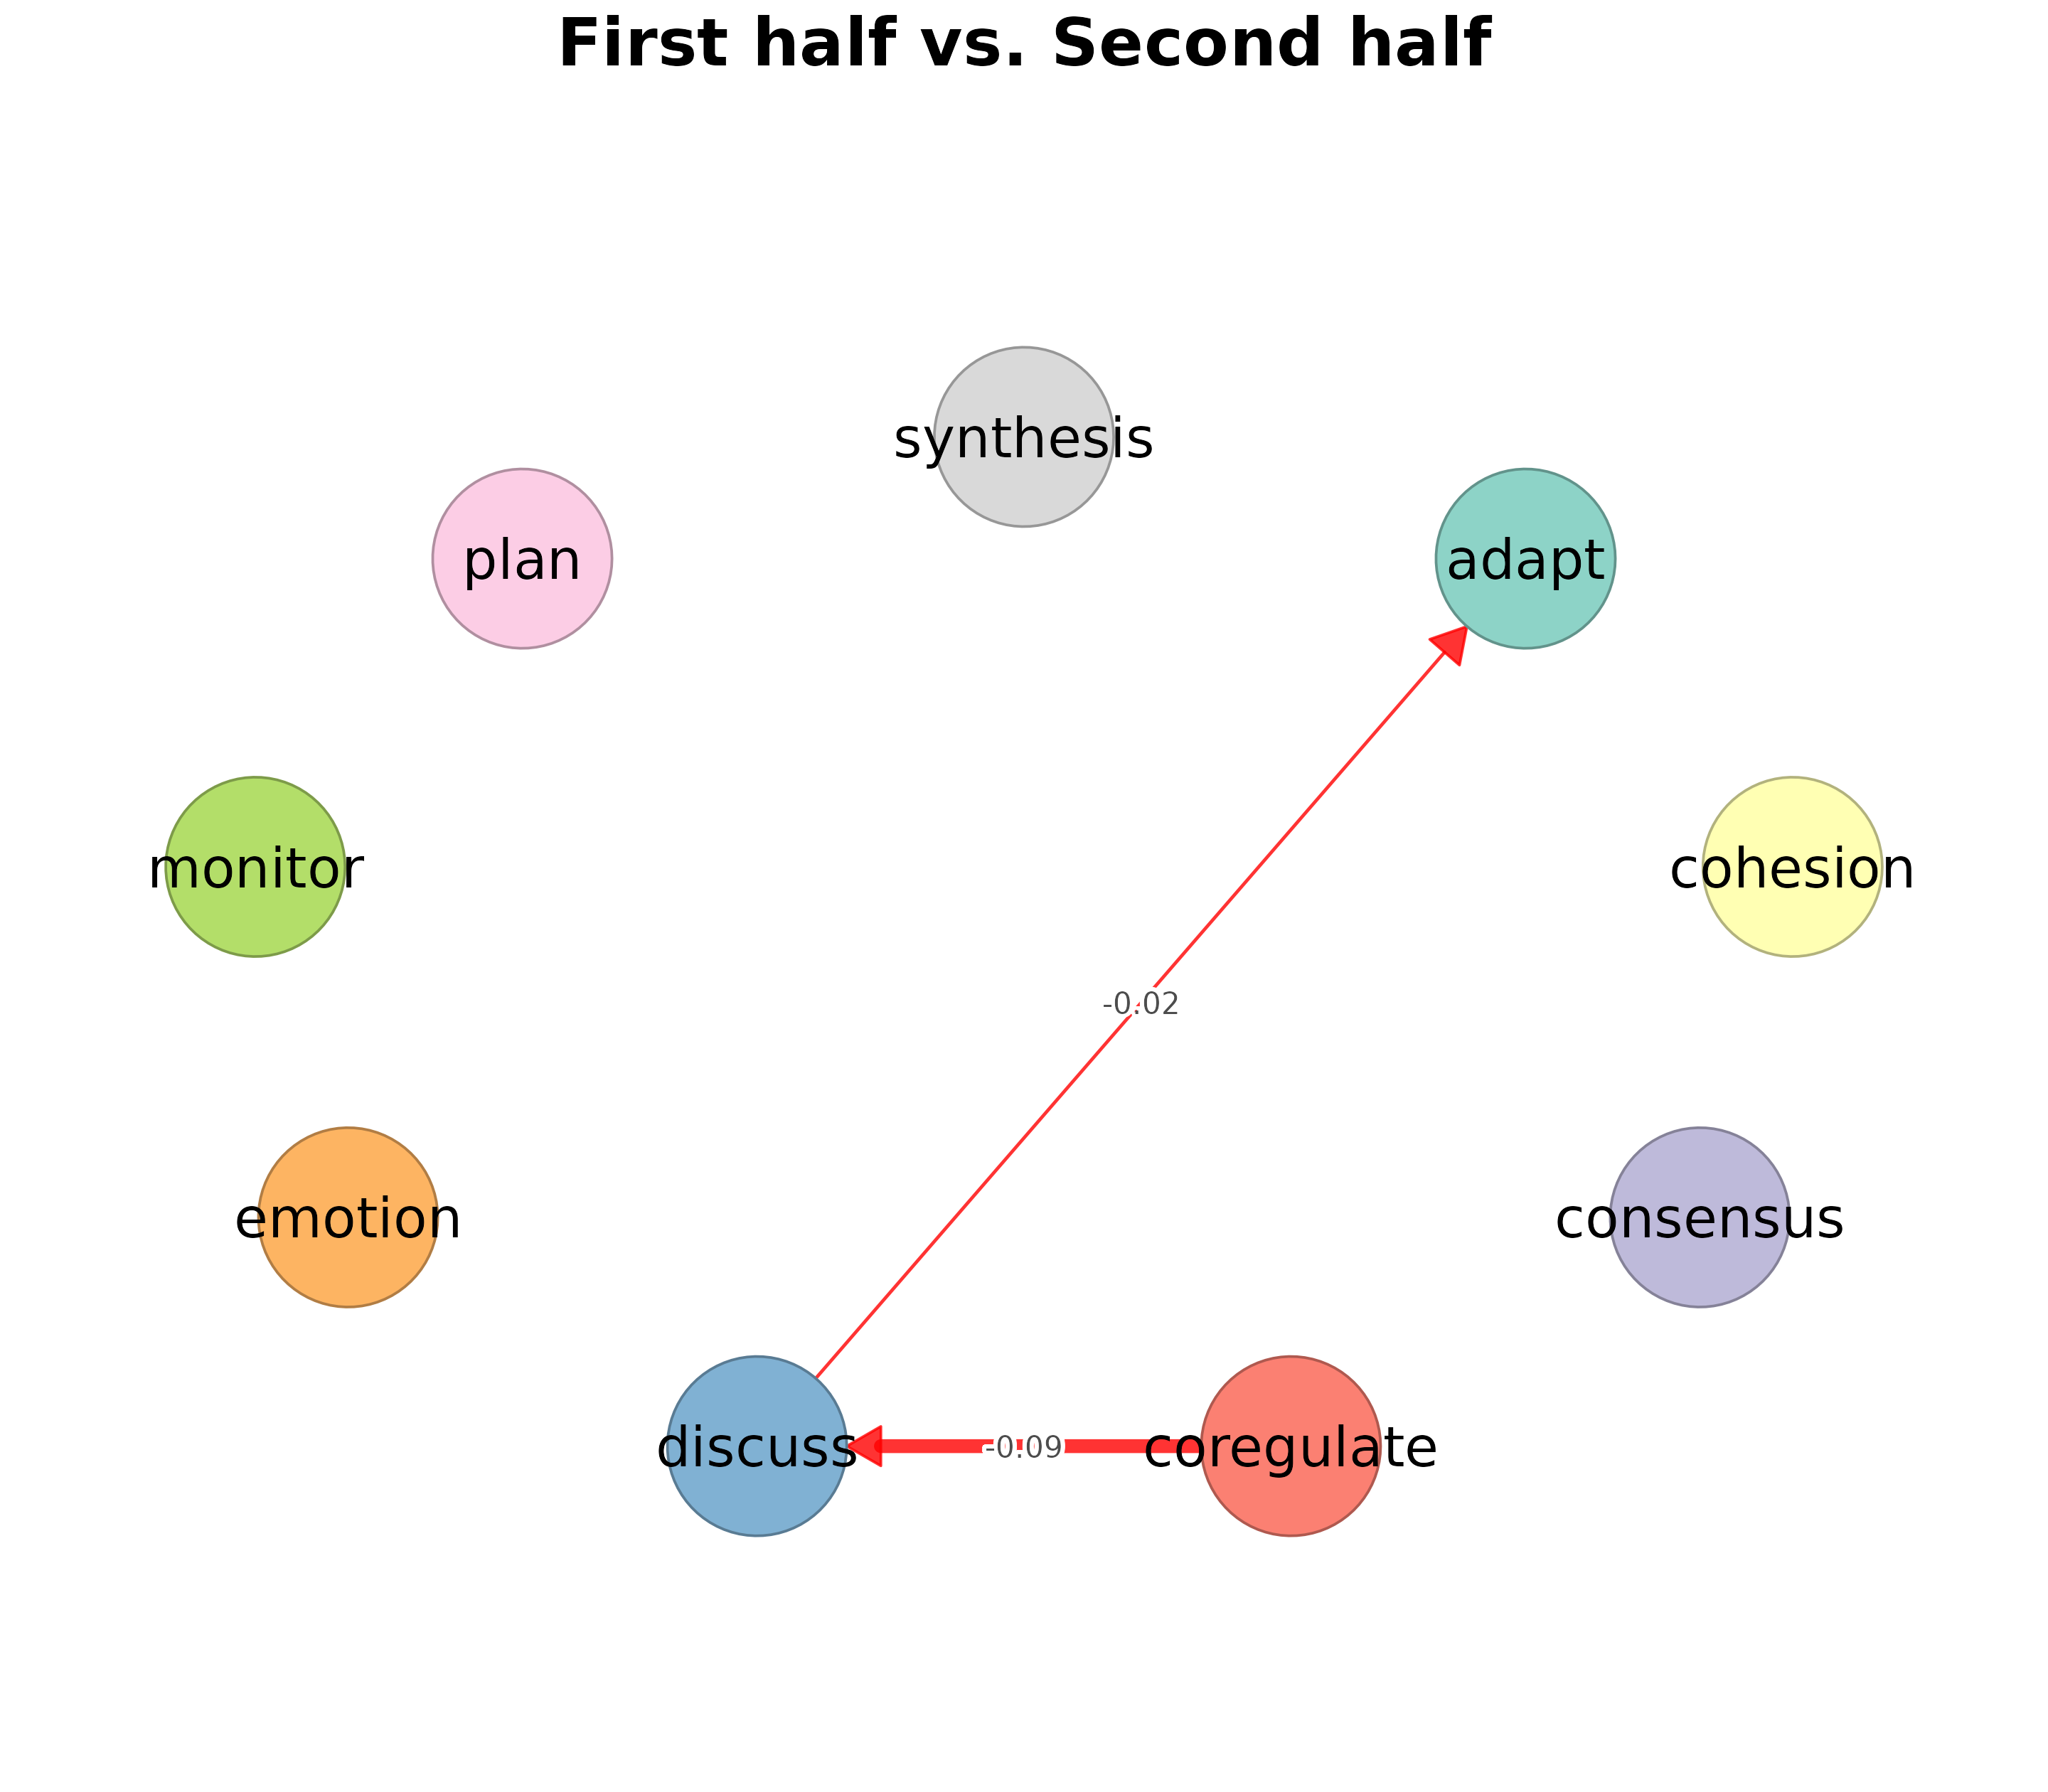
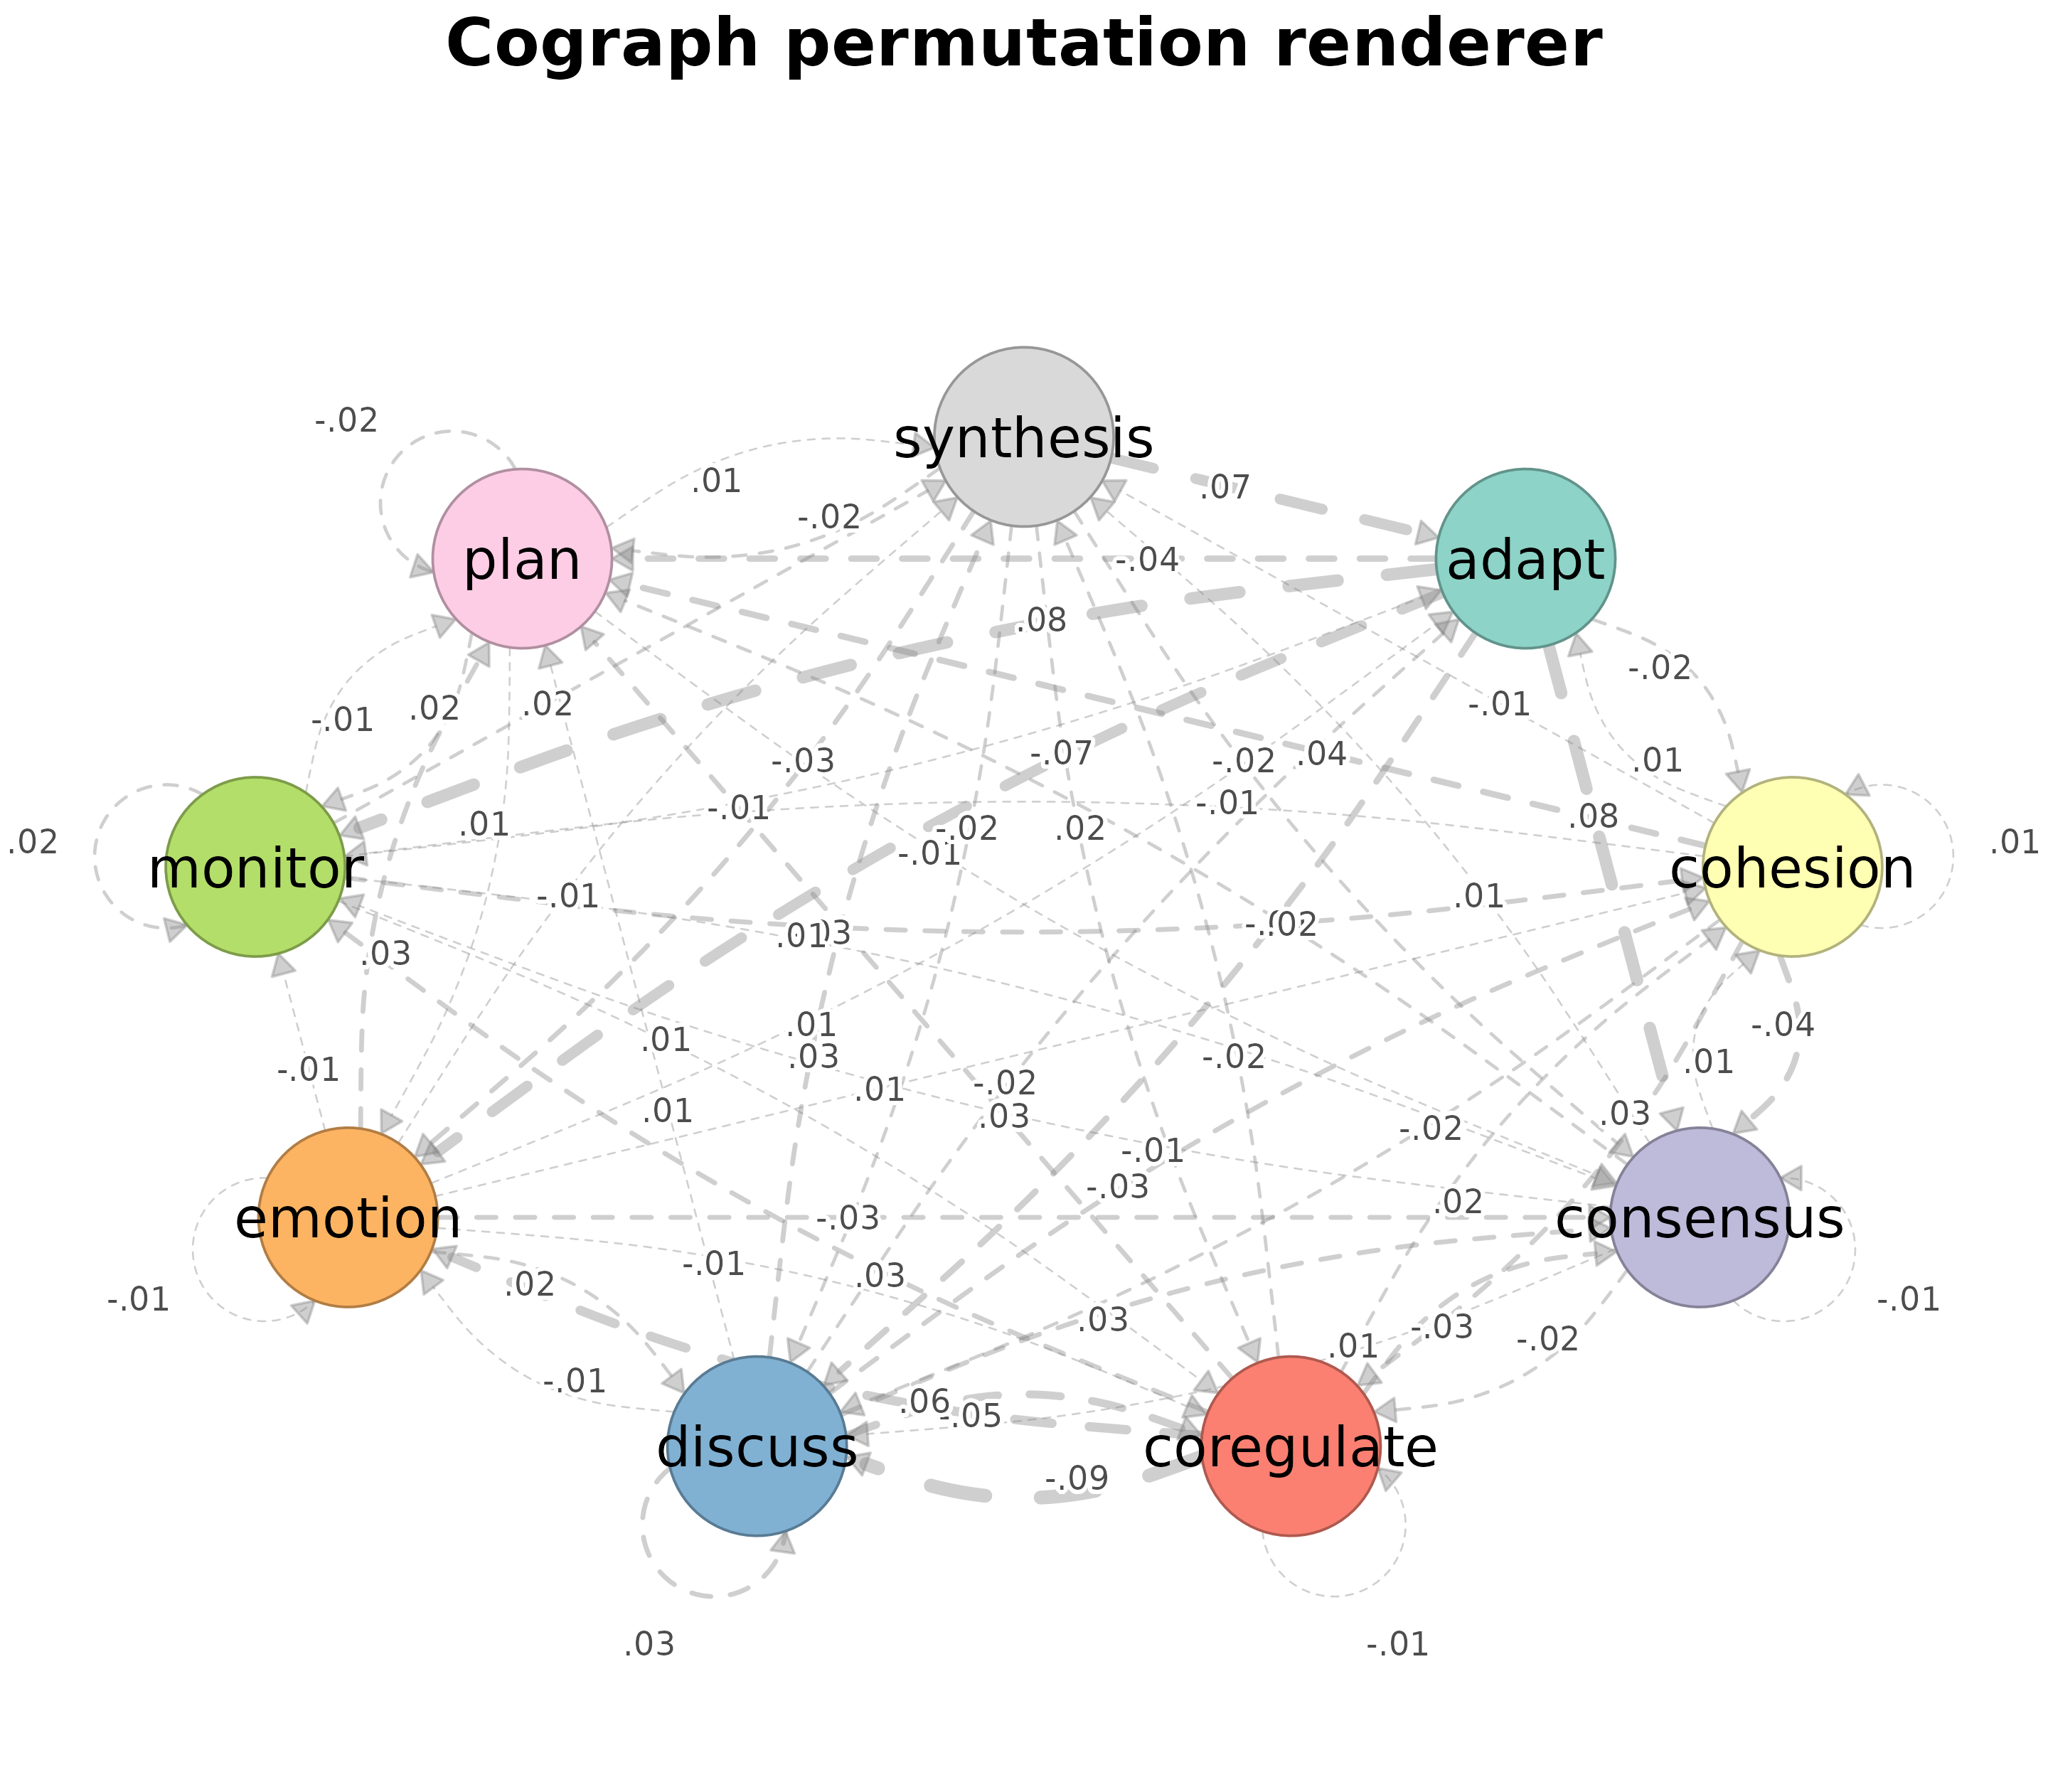
Cograph permutation renderer
Exercises the richer cograph permutation display directly.
cograph::plot_permutation(
  permutation_result,
  title = "Cograph permutation renderer",
  show_nonsig = TRUE
)
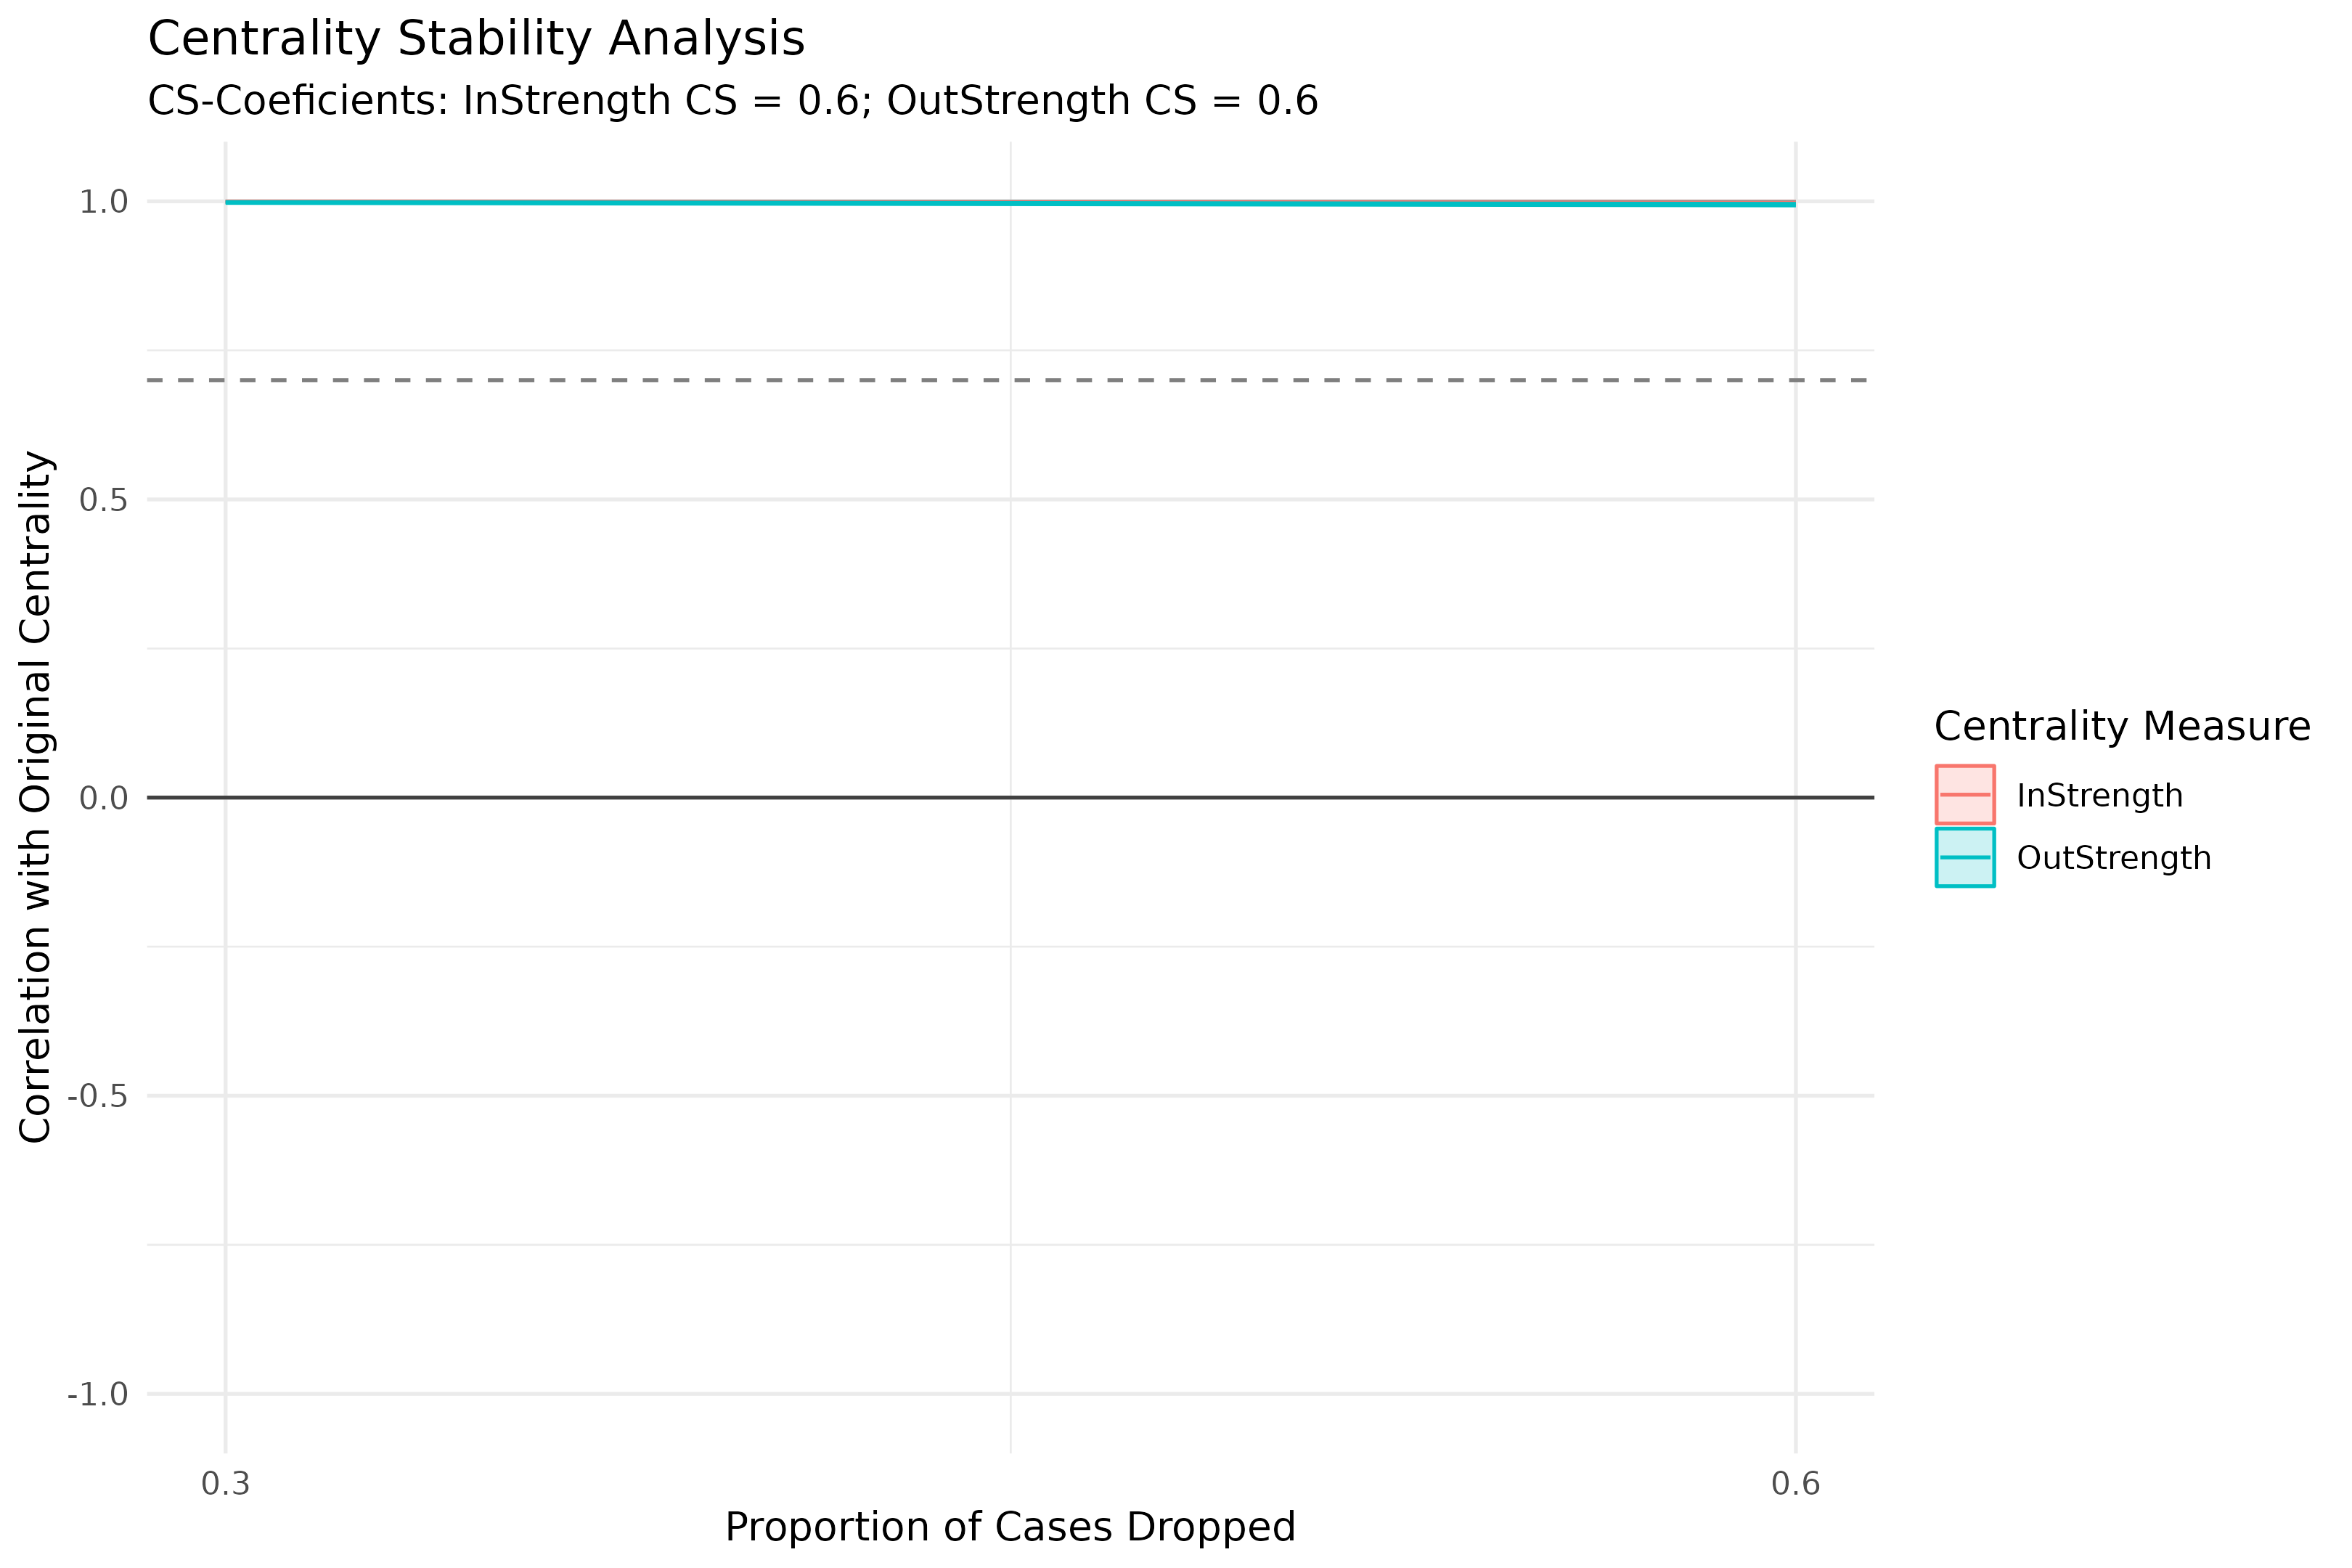
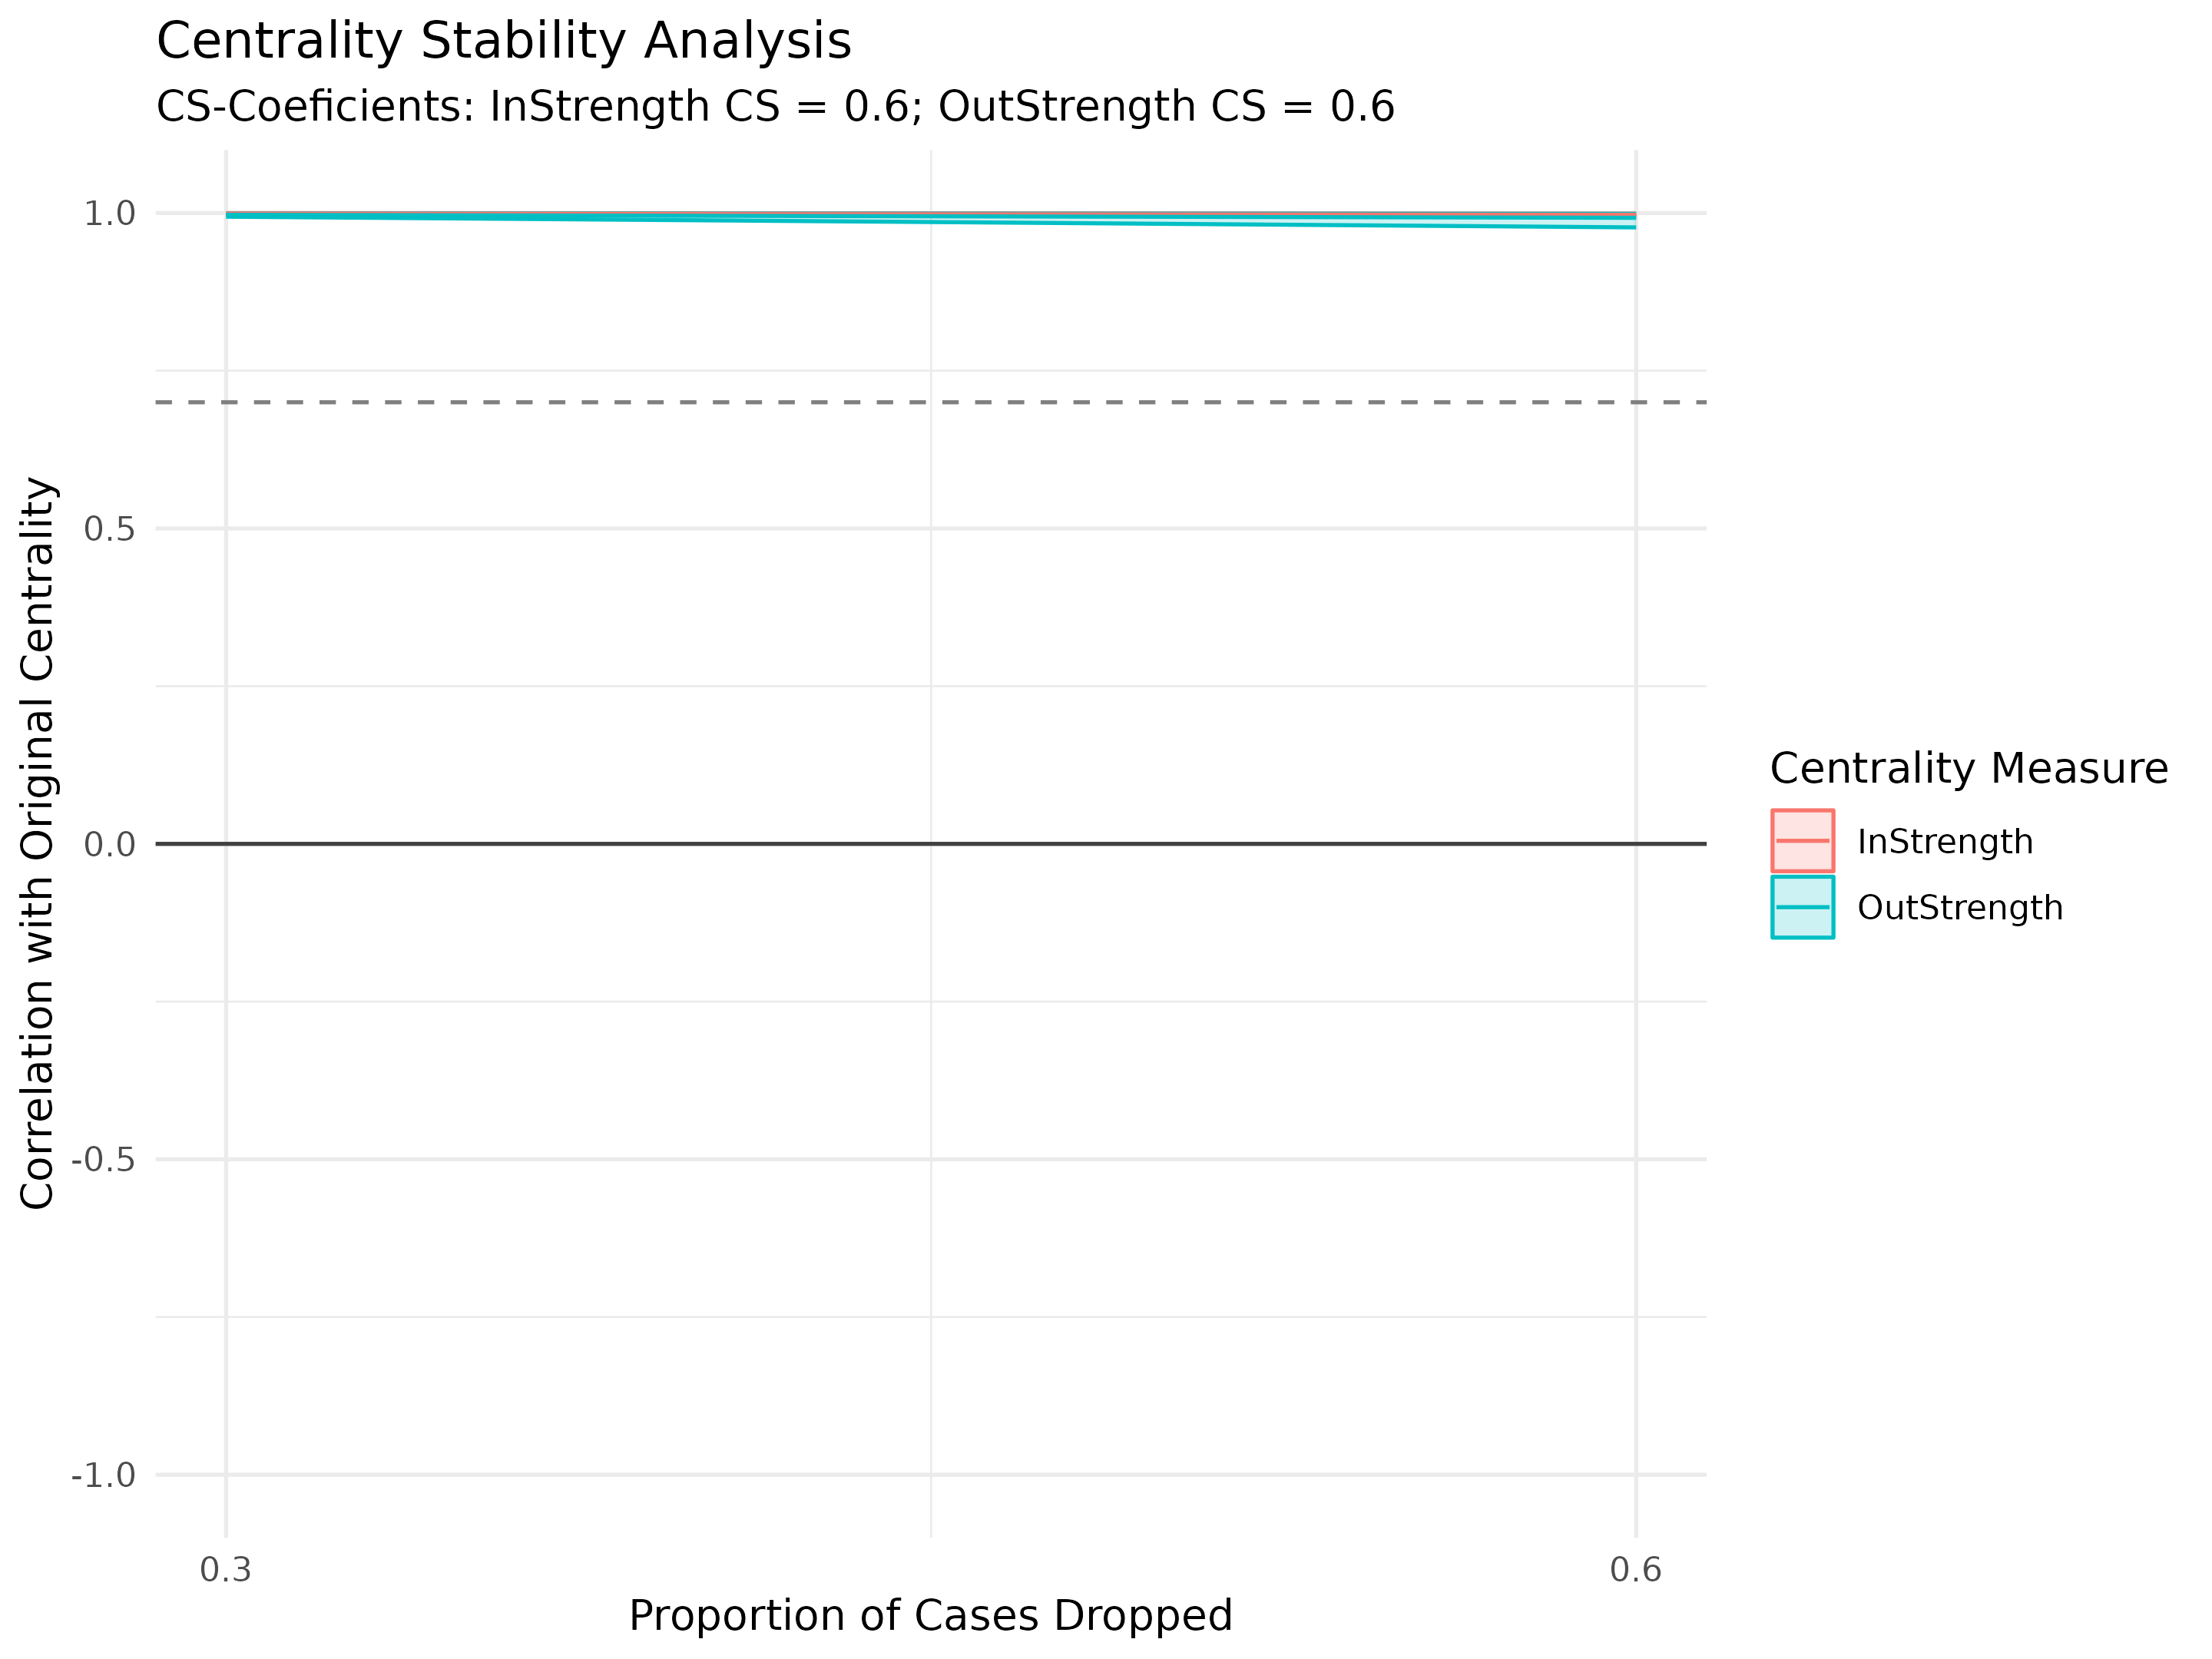
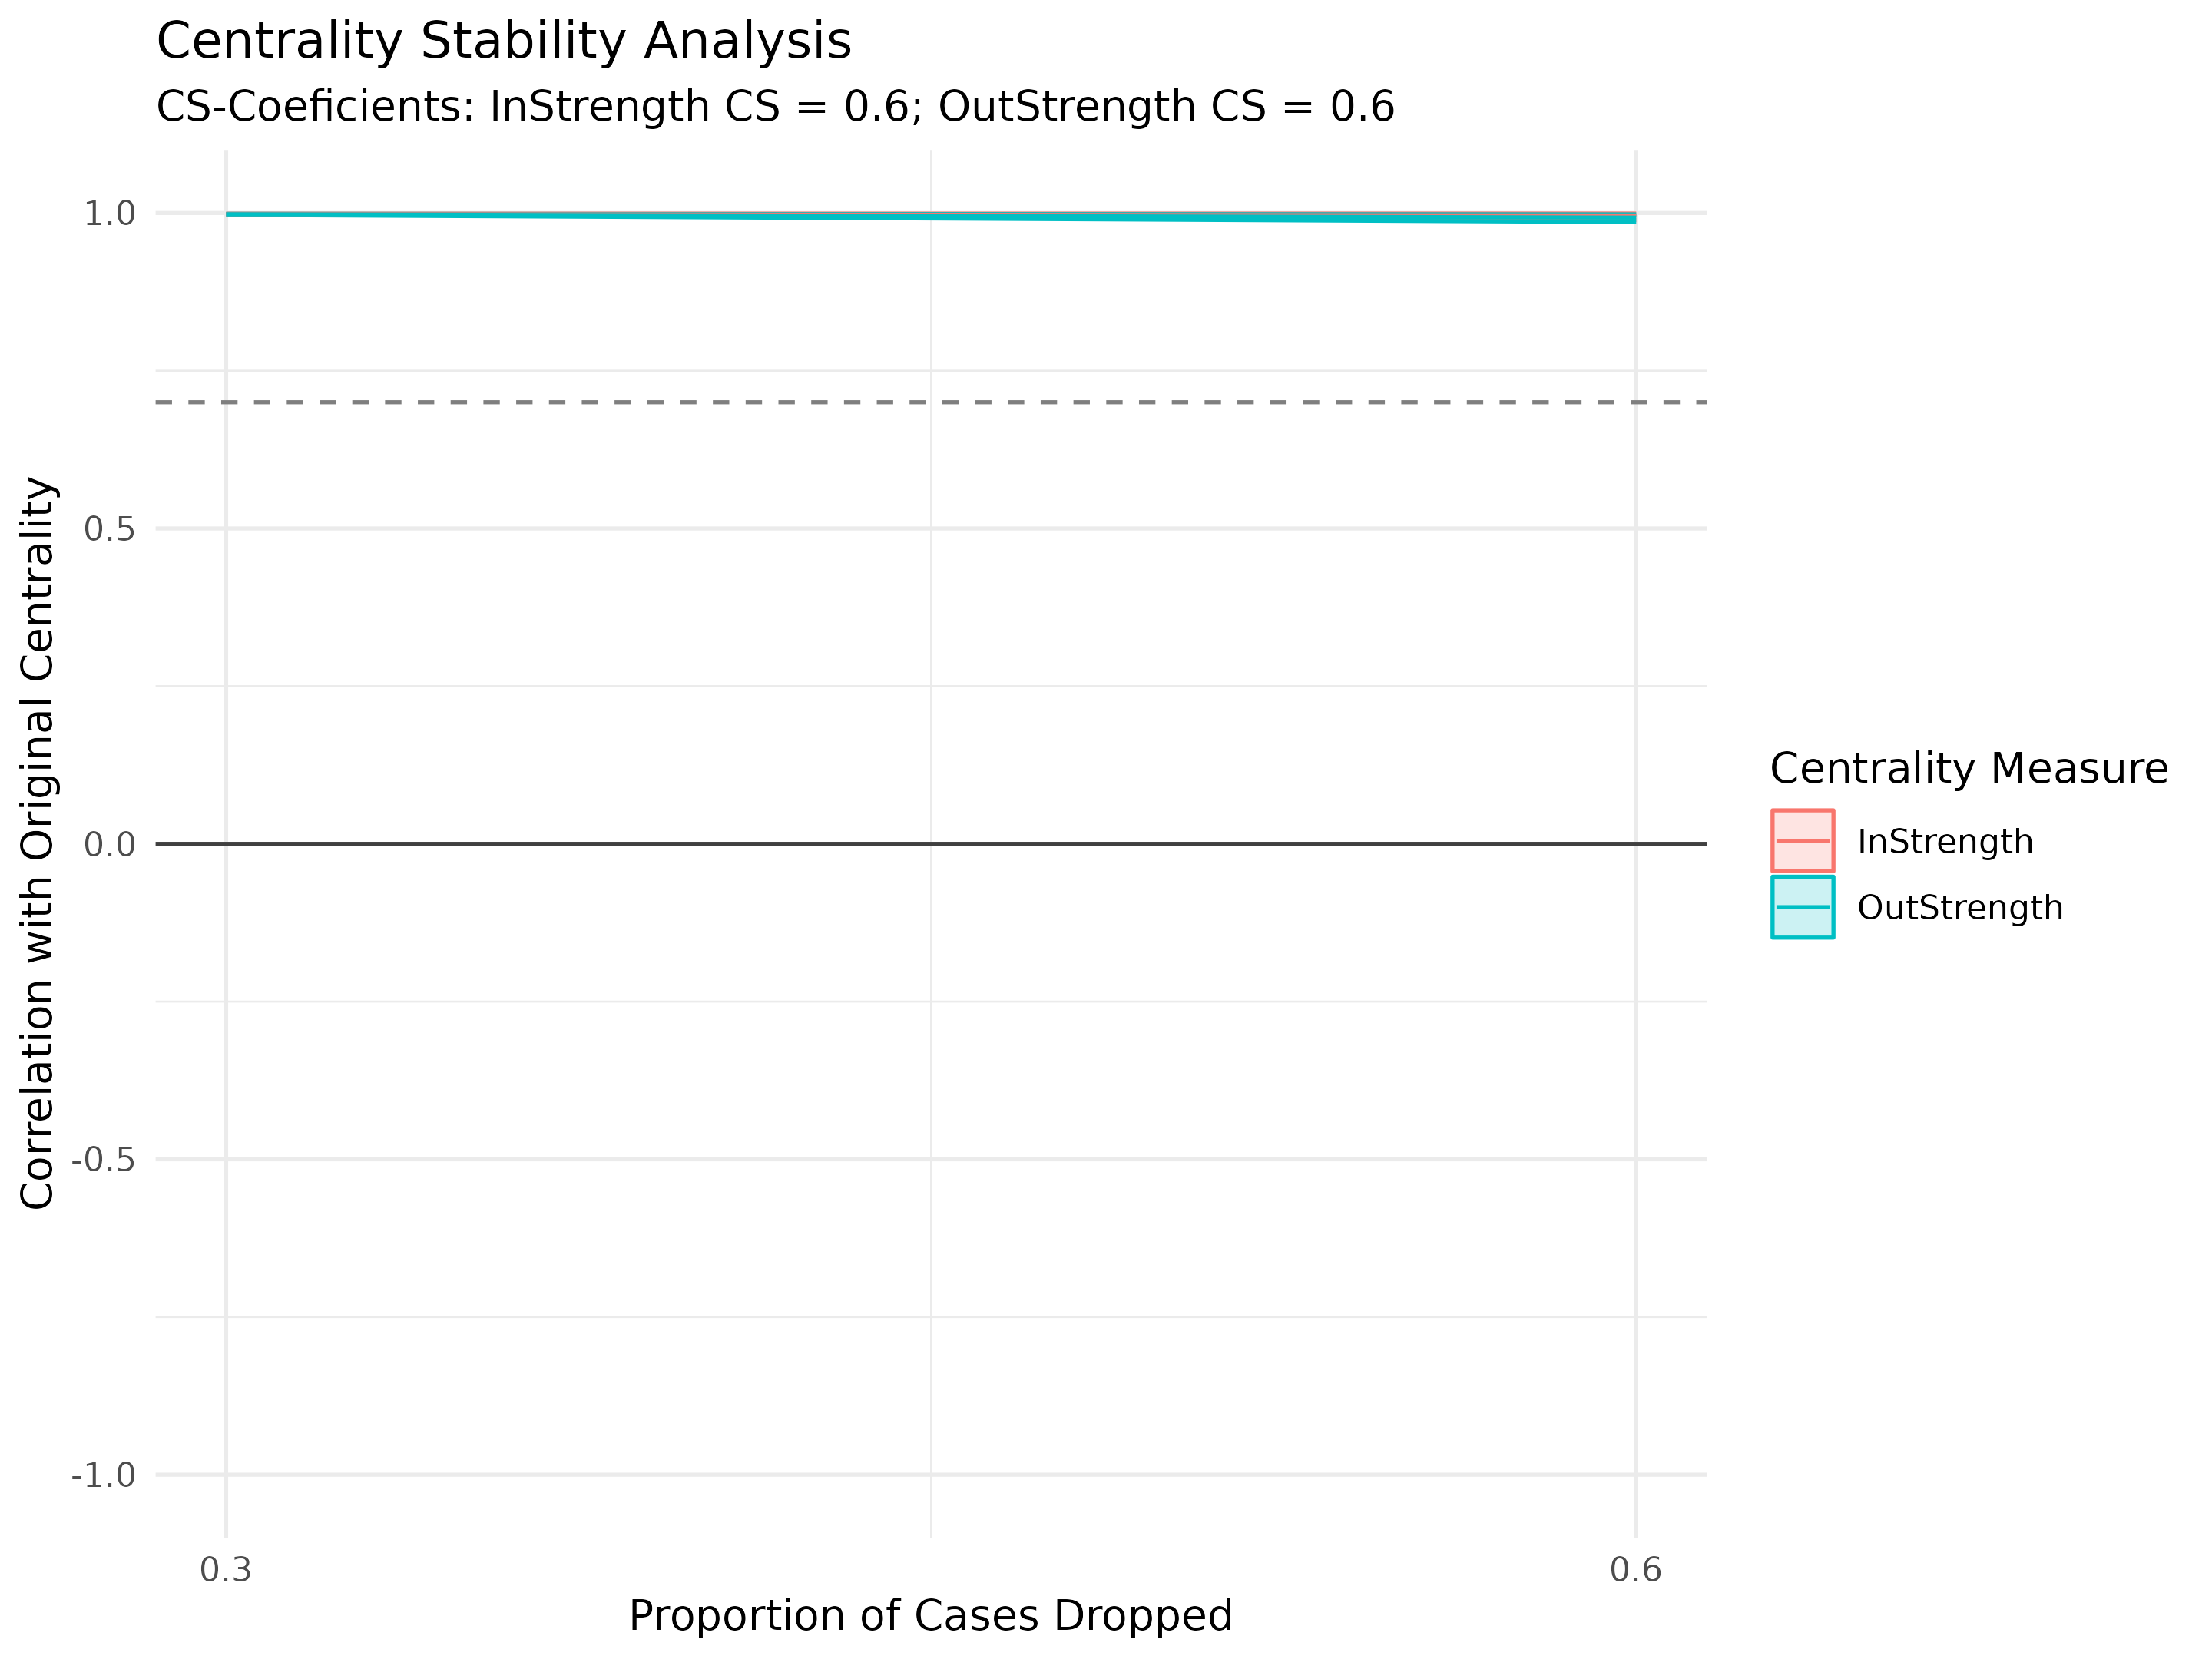
Stability and reliability plots
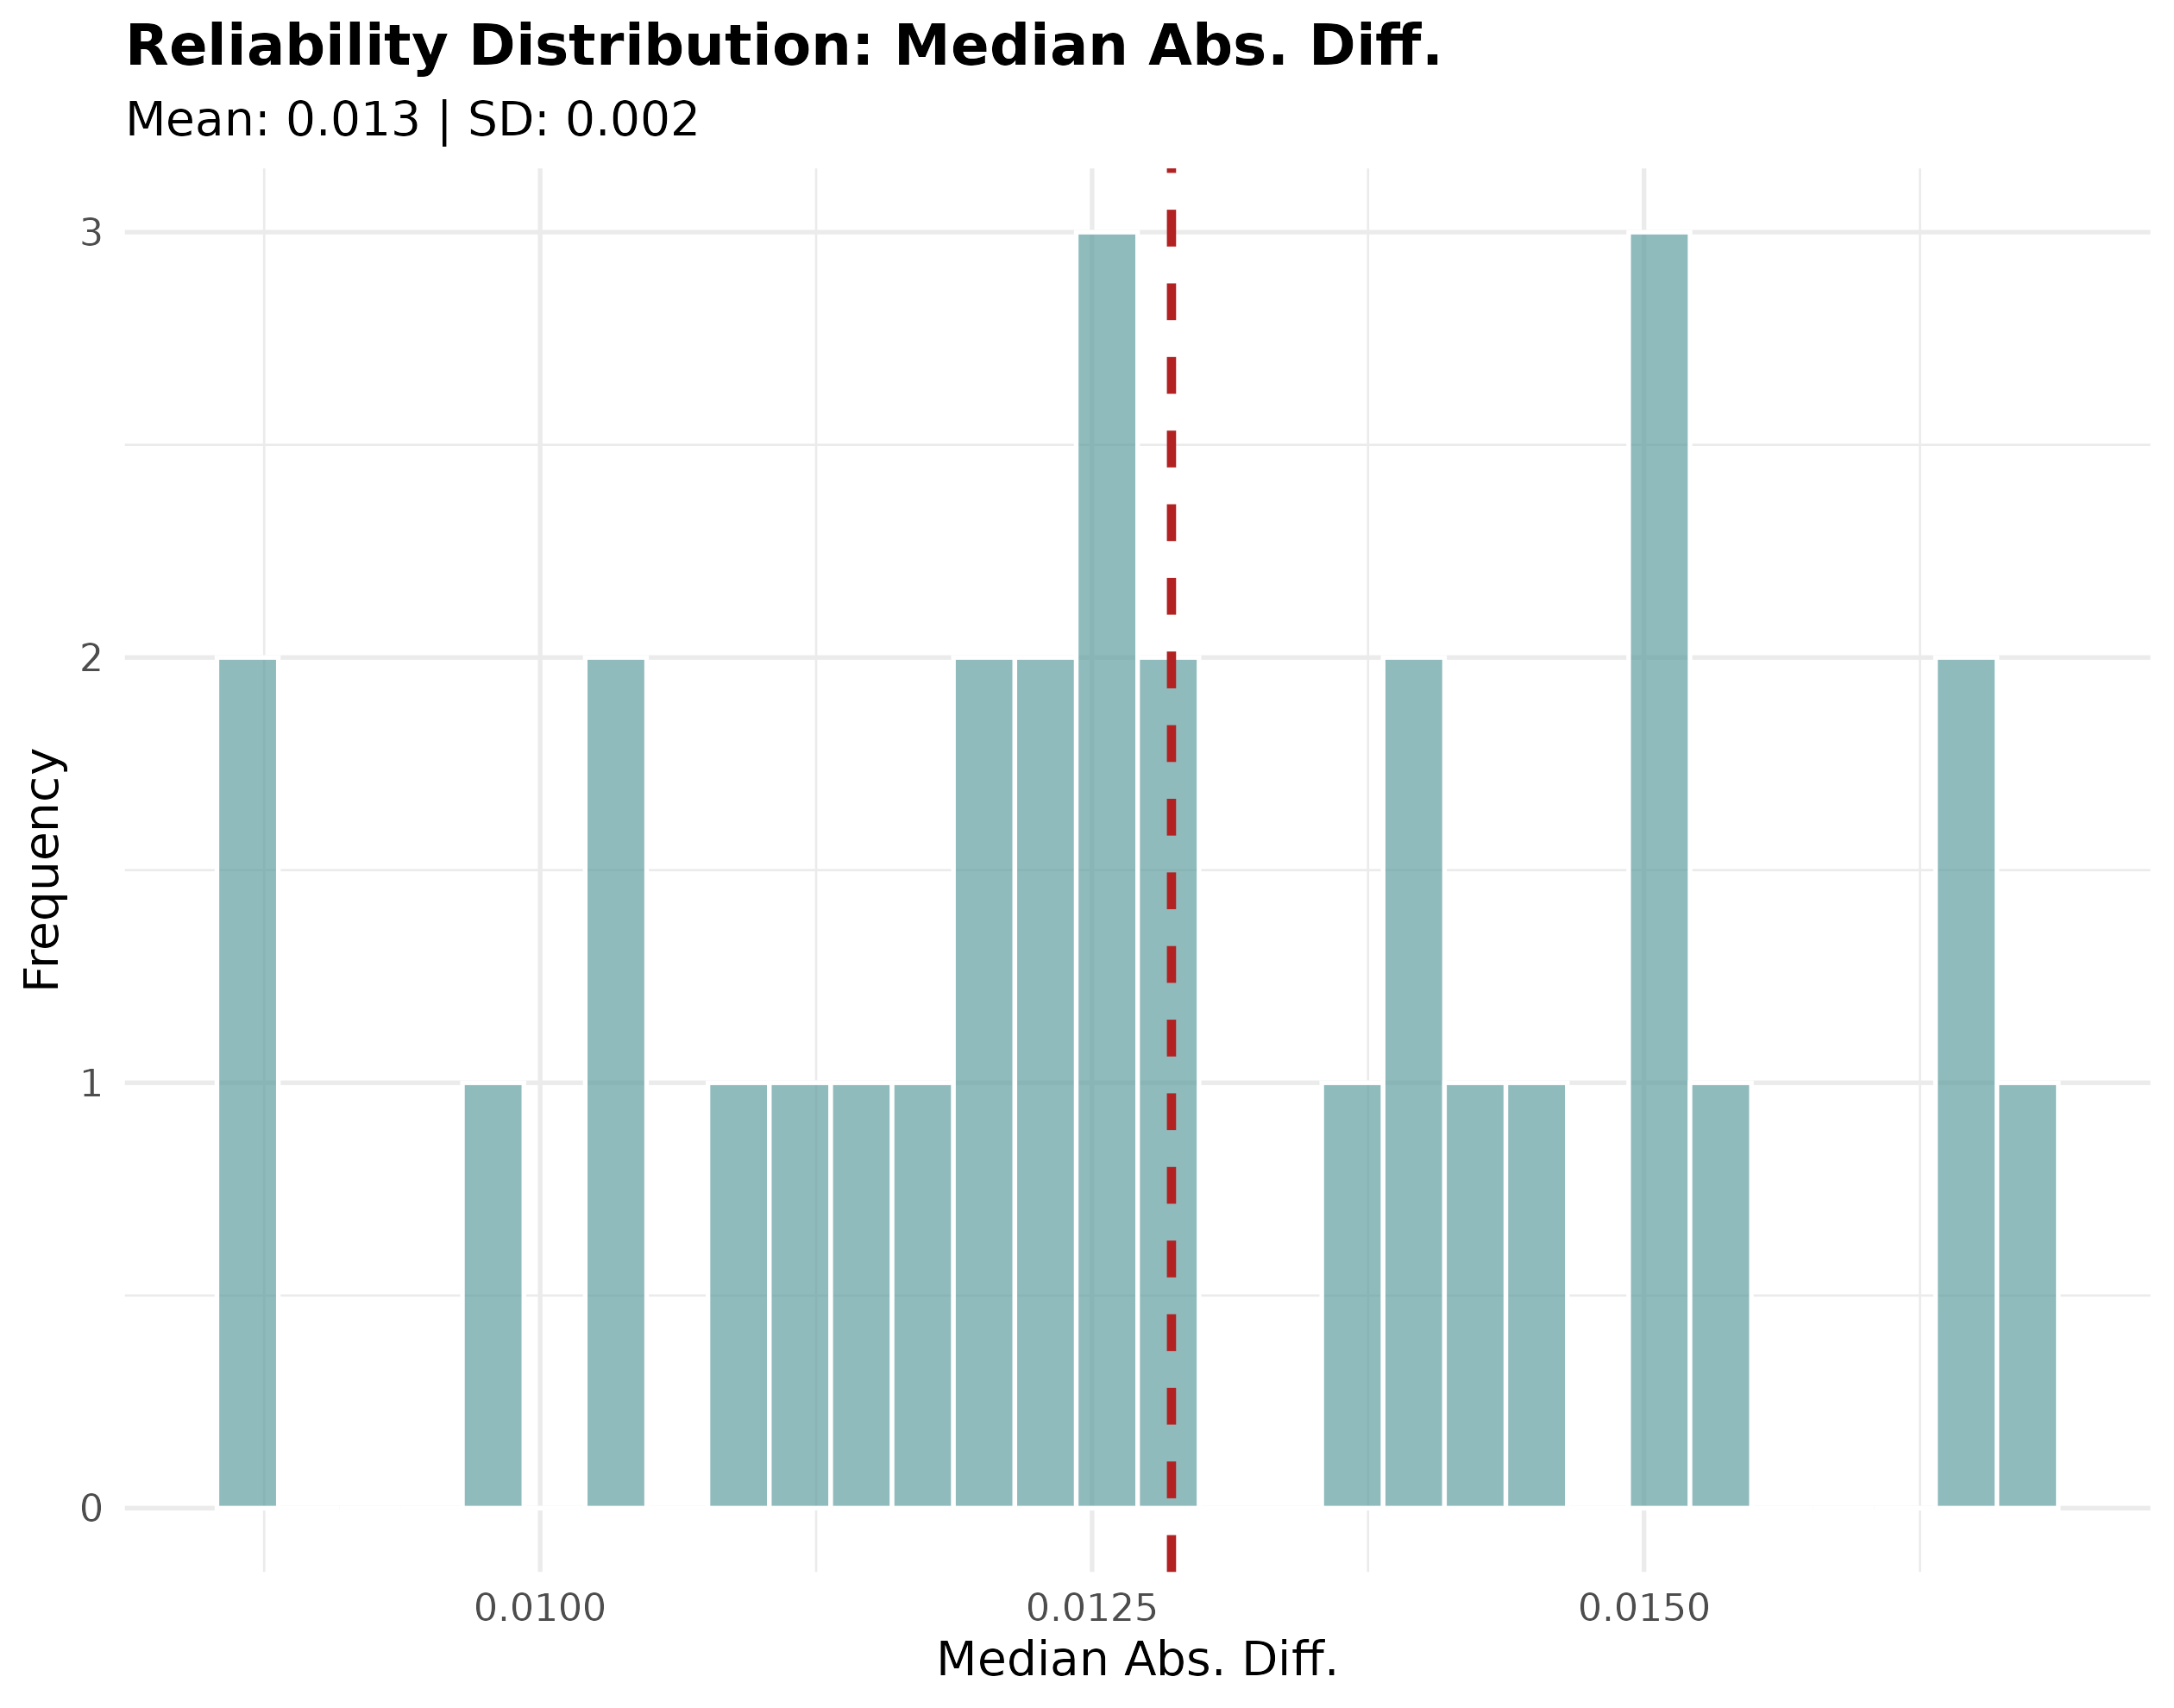
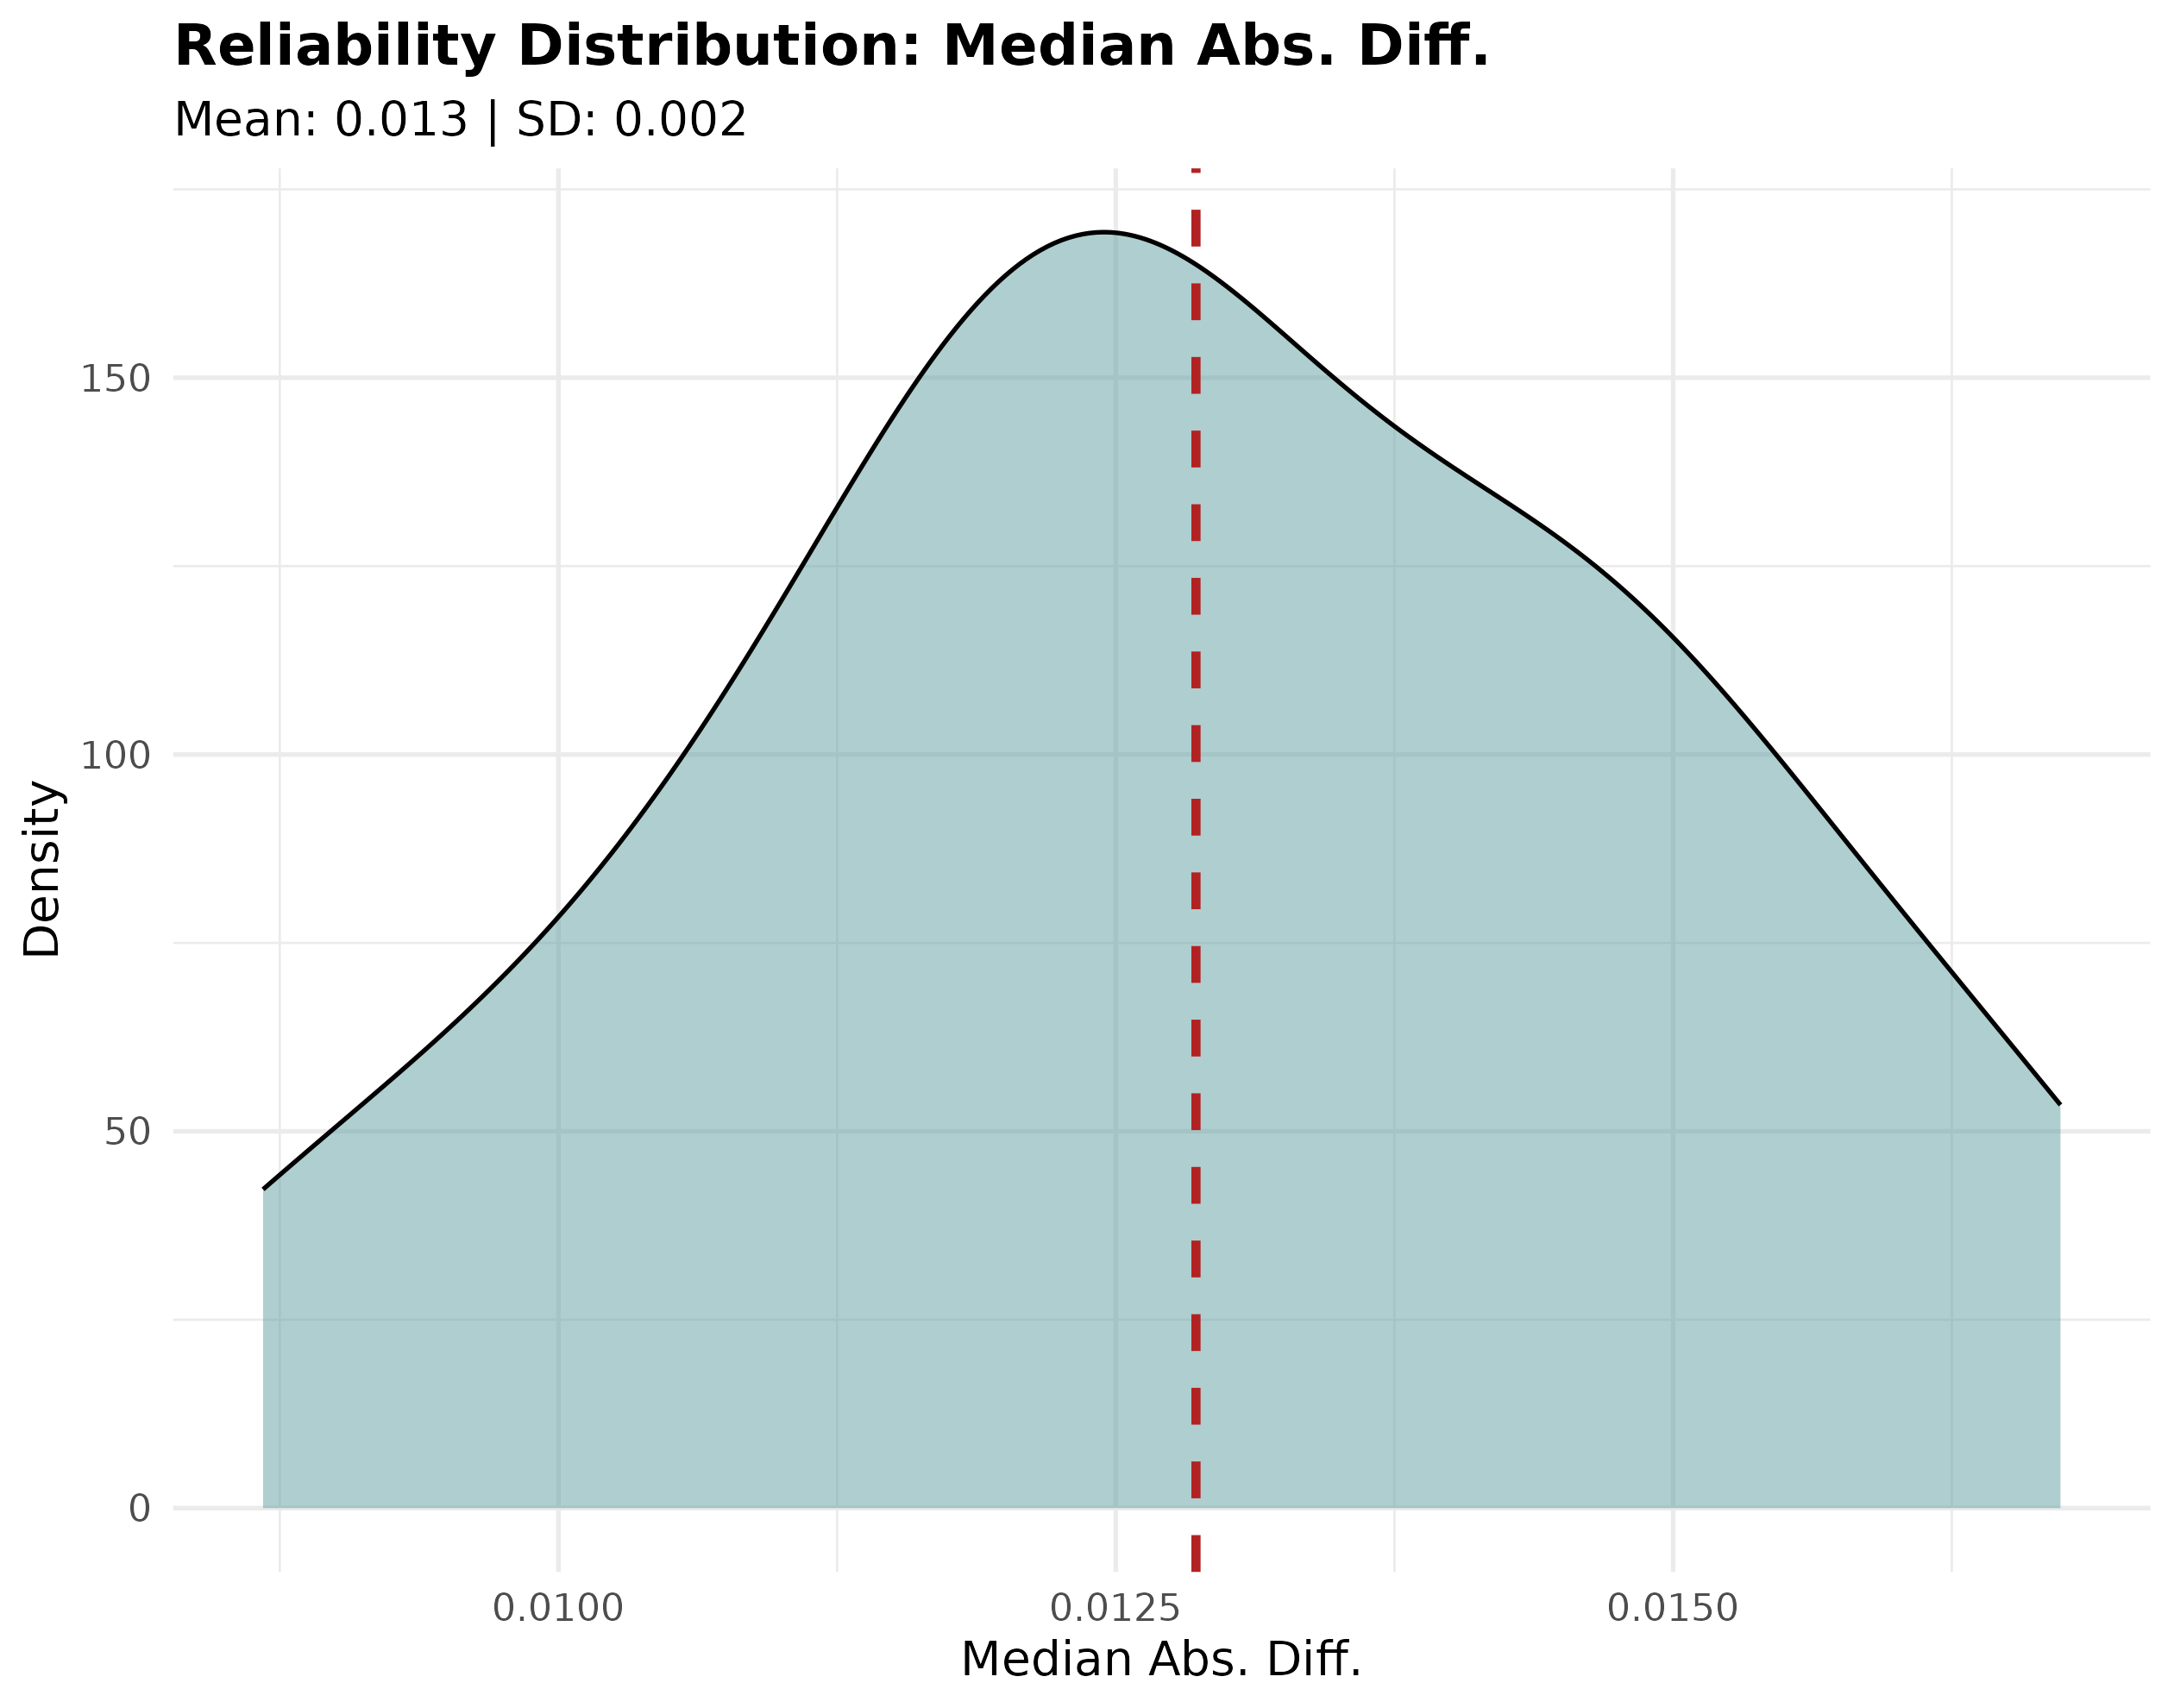
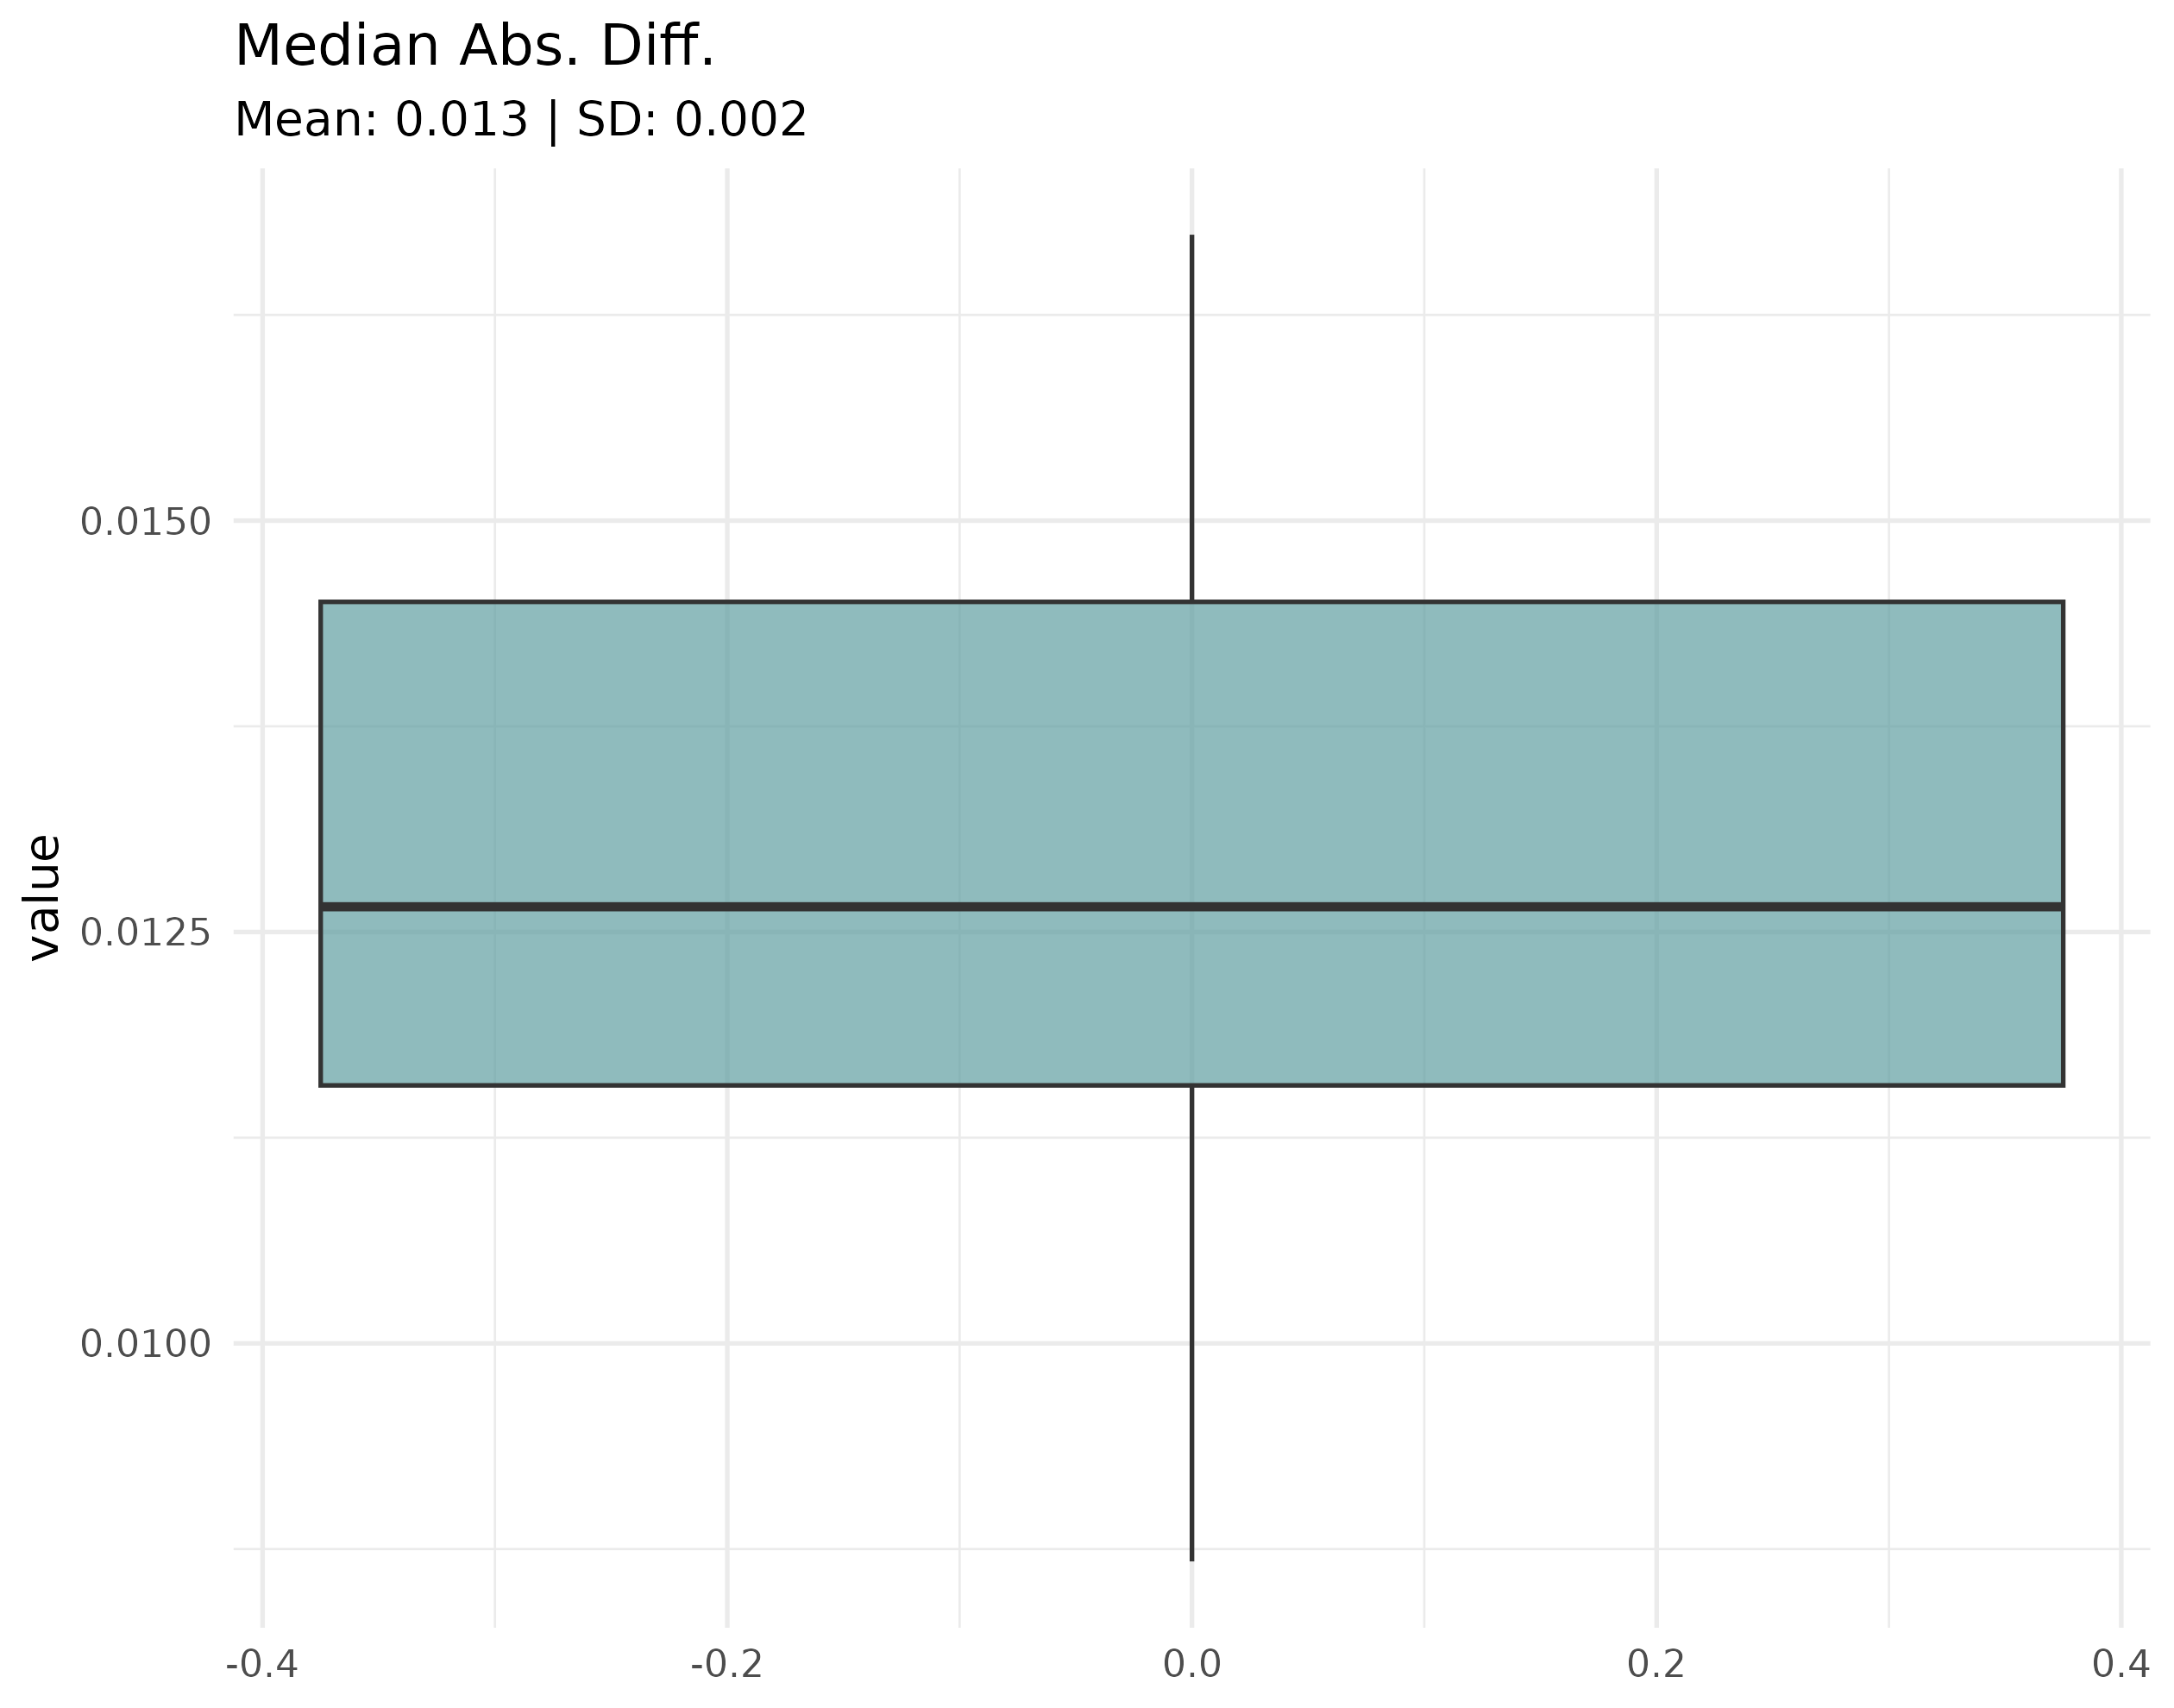
Comparison plots
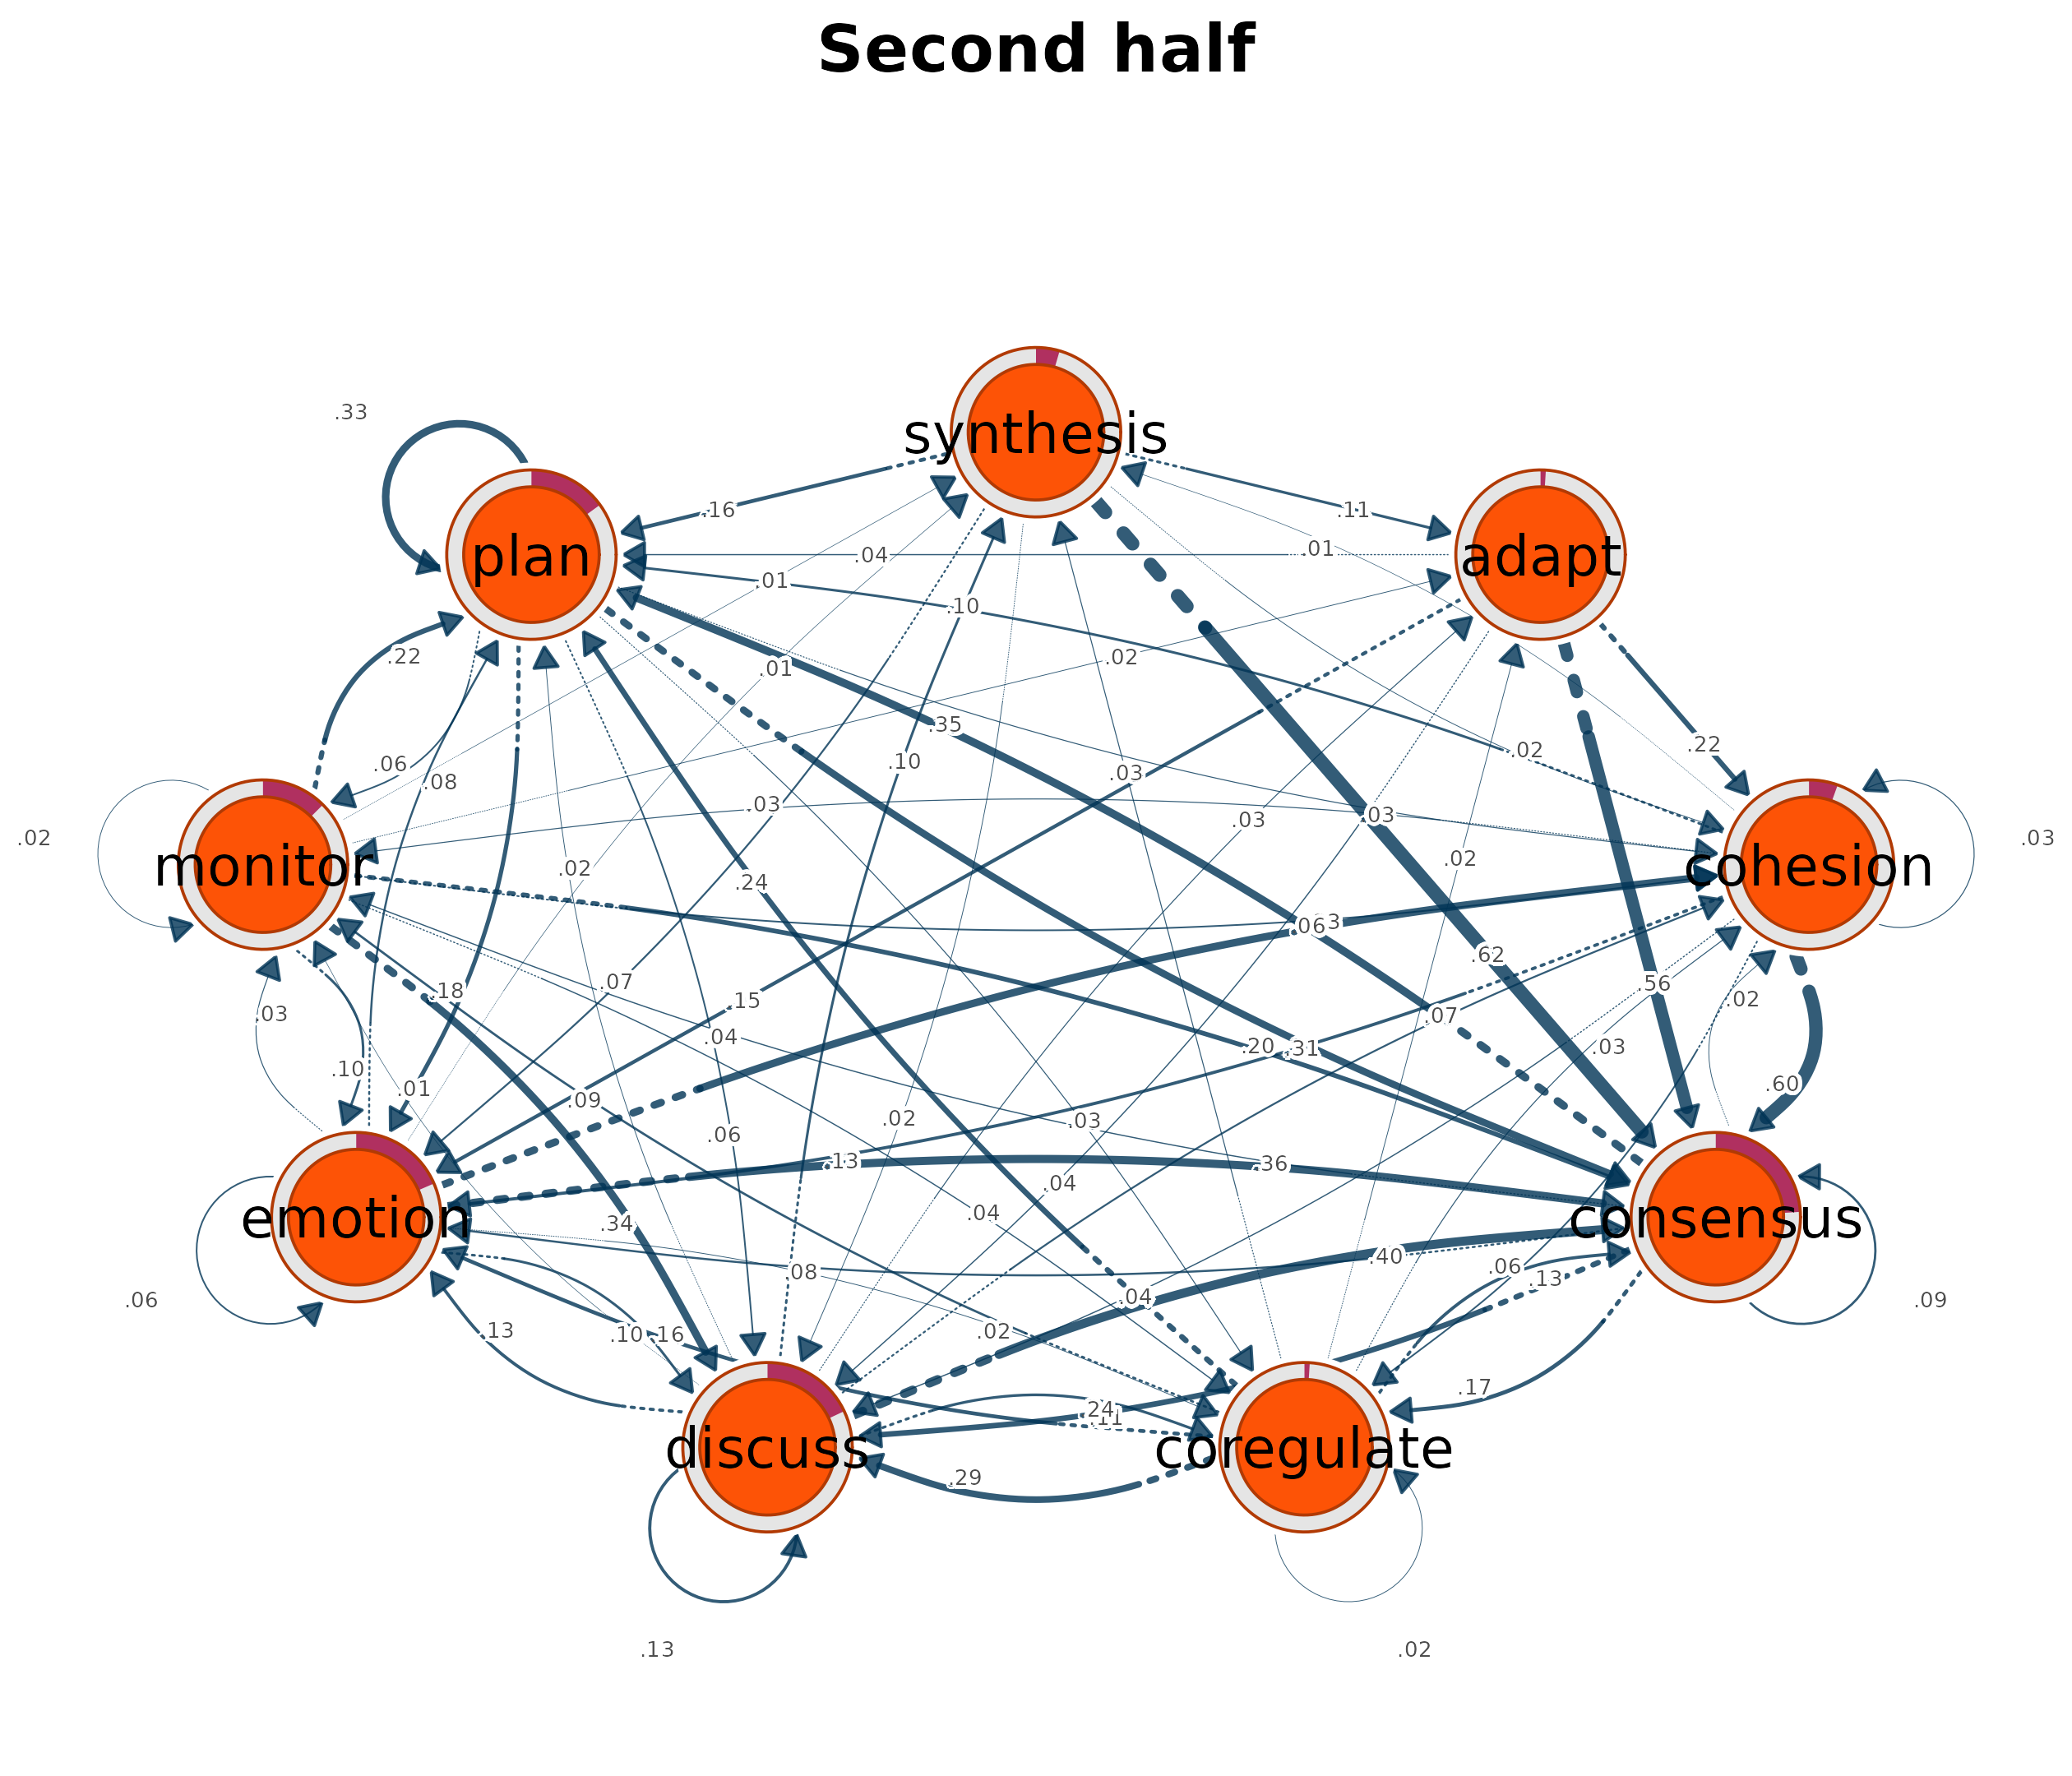
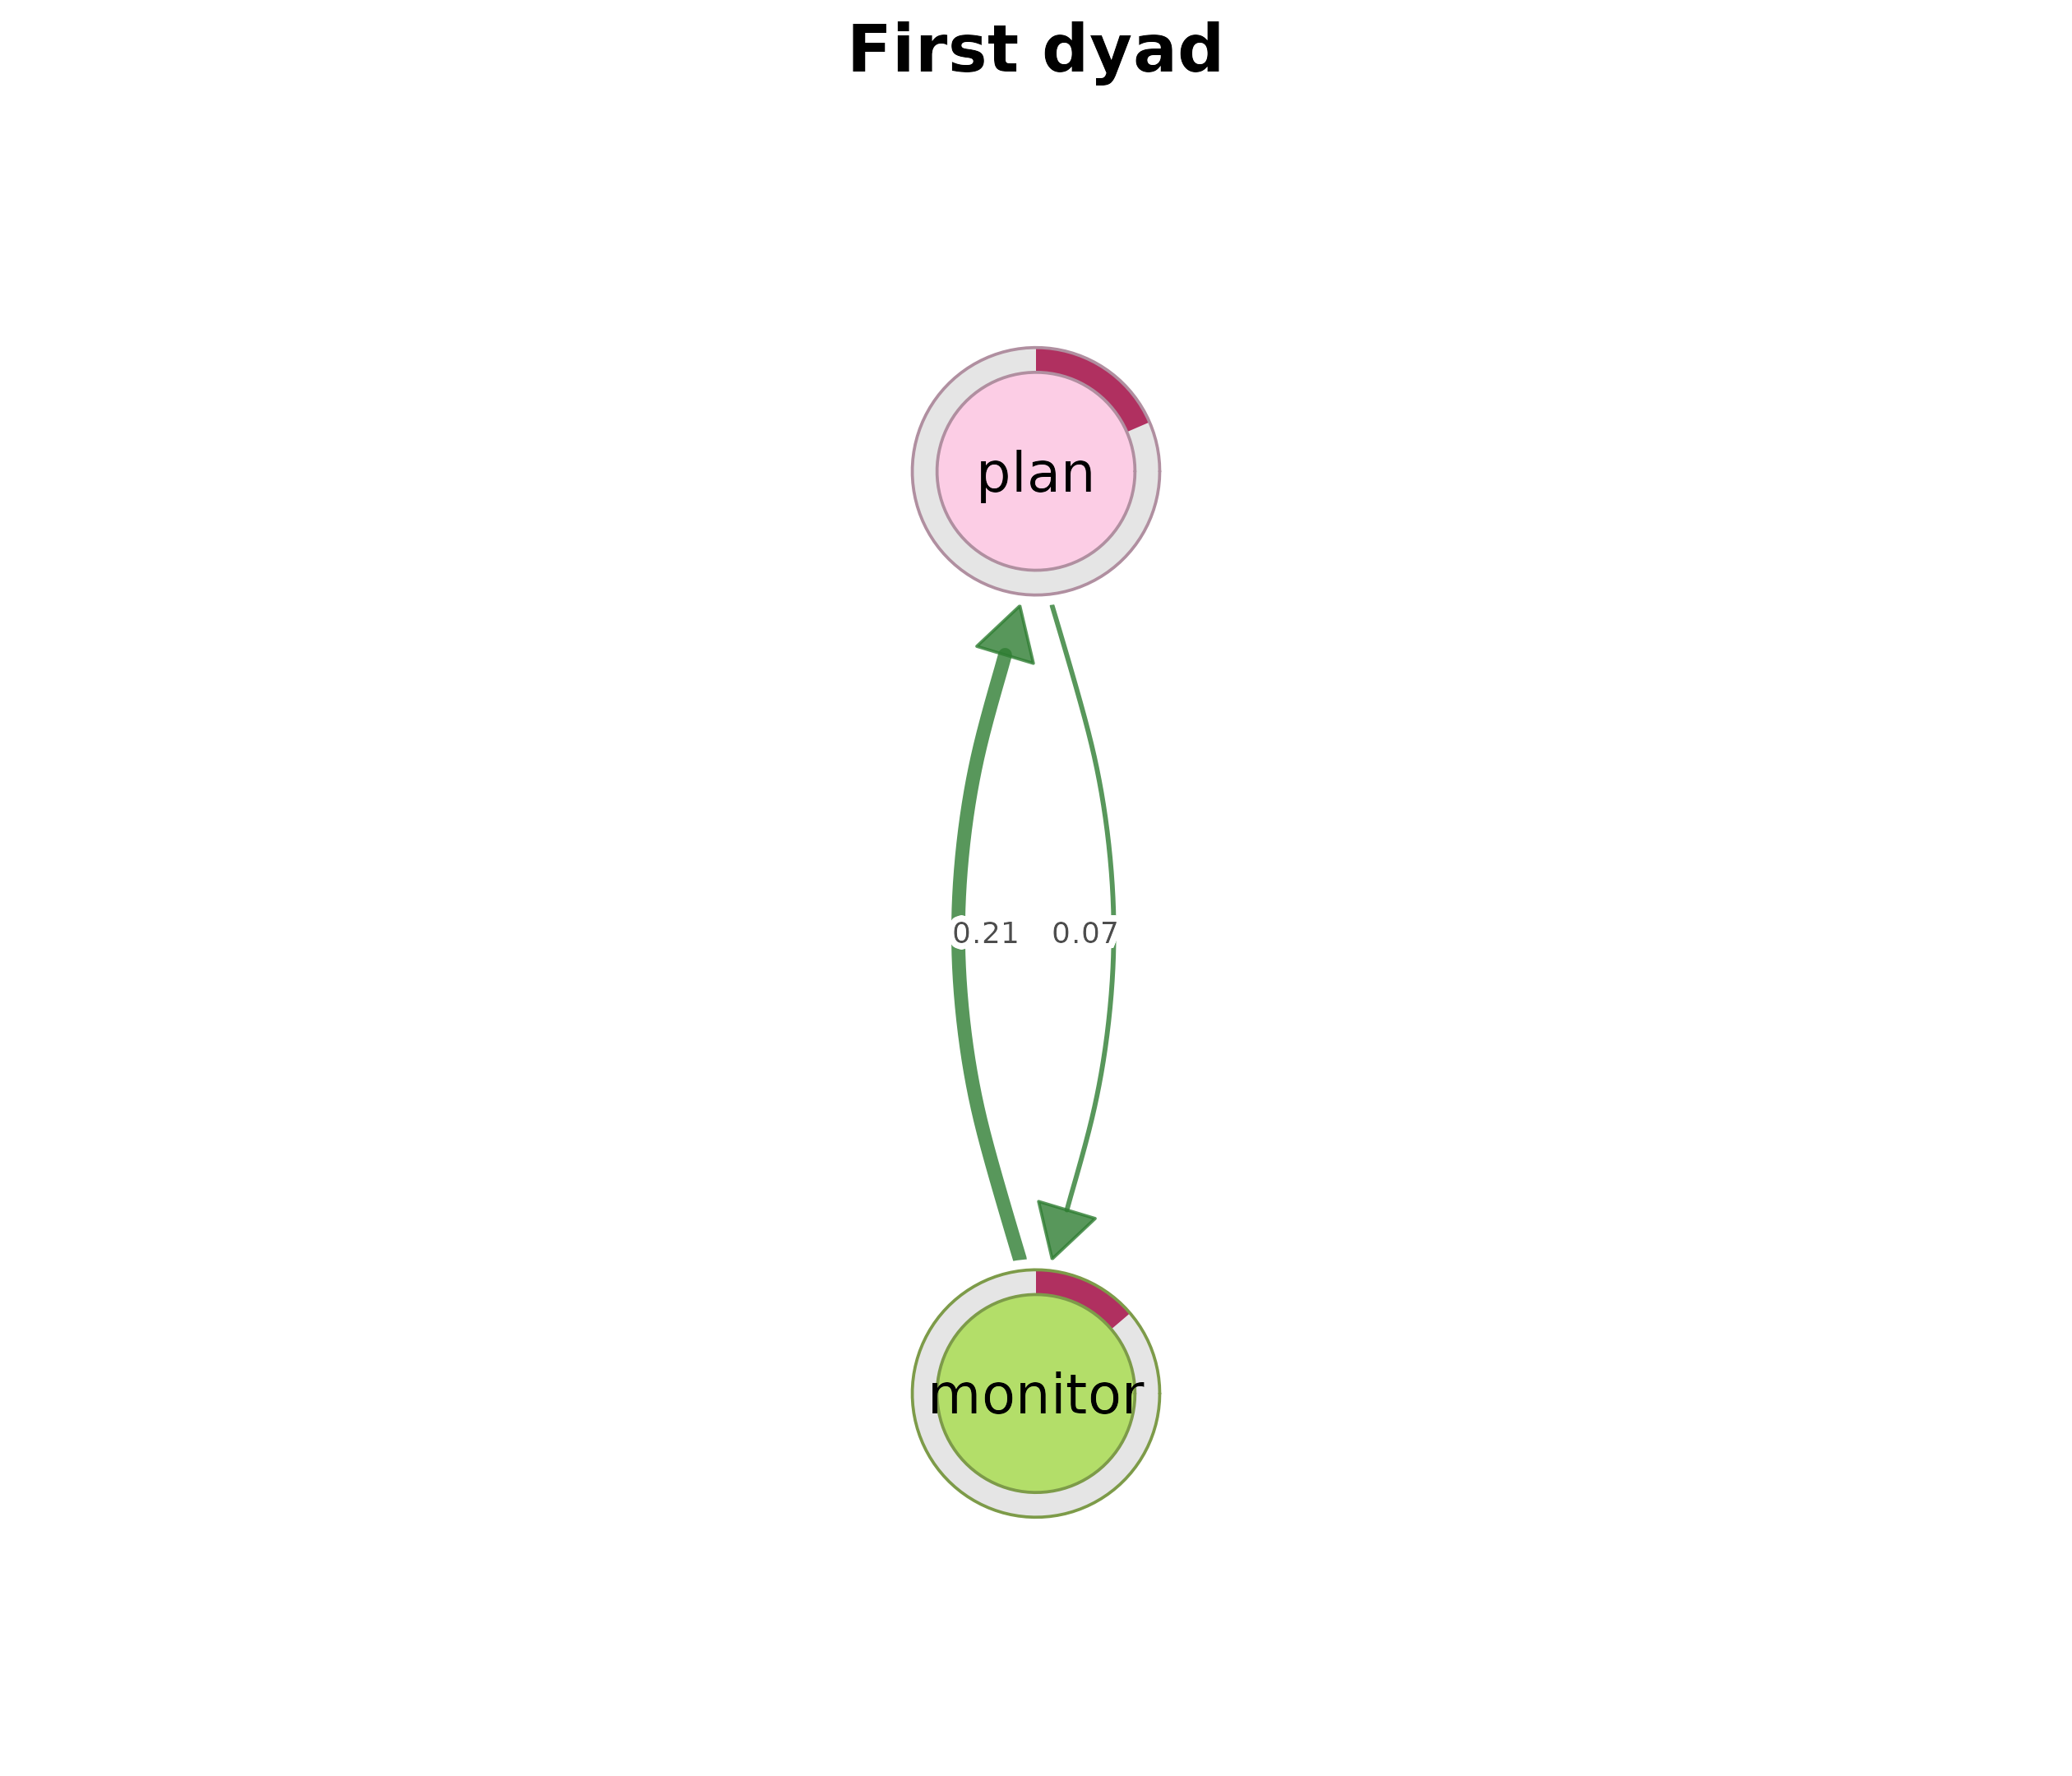
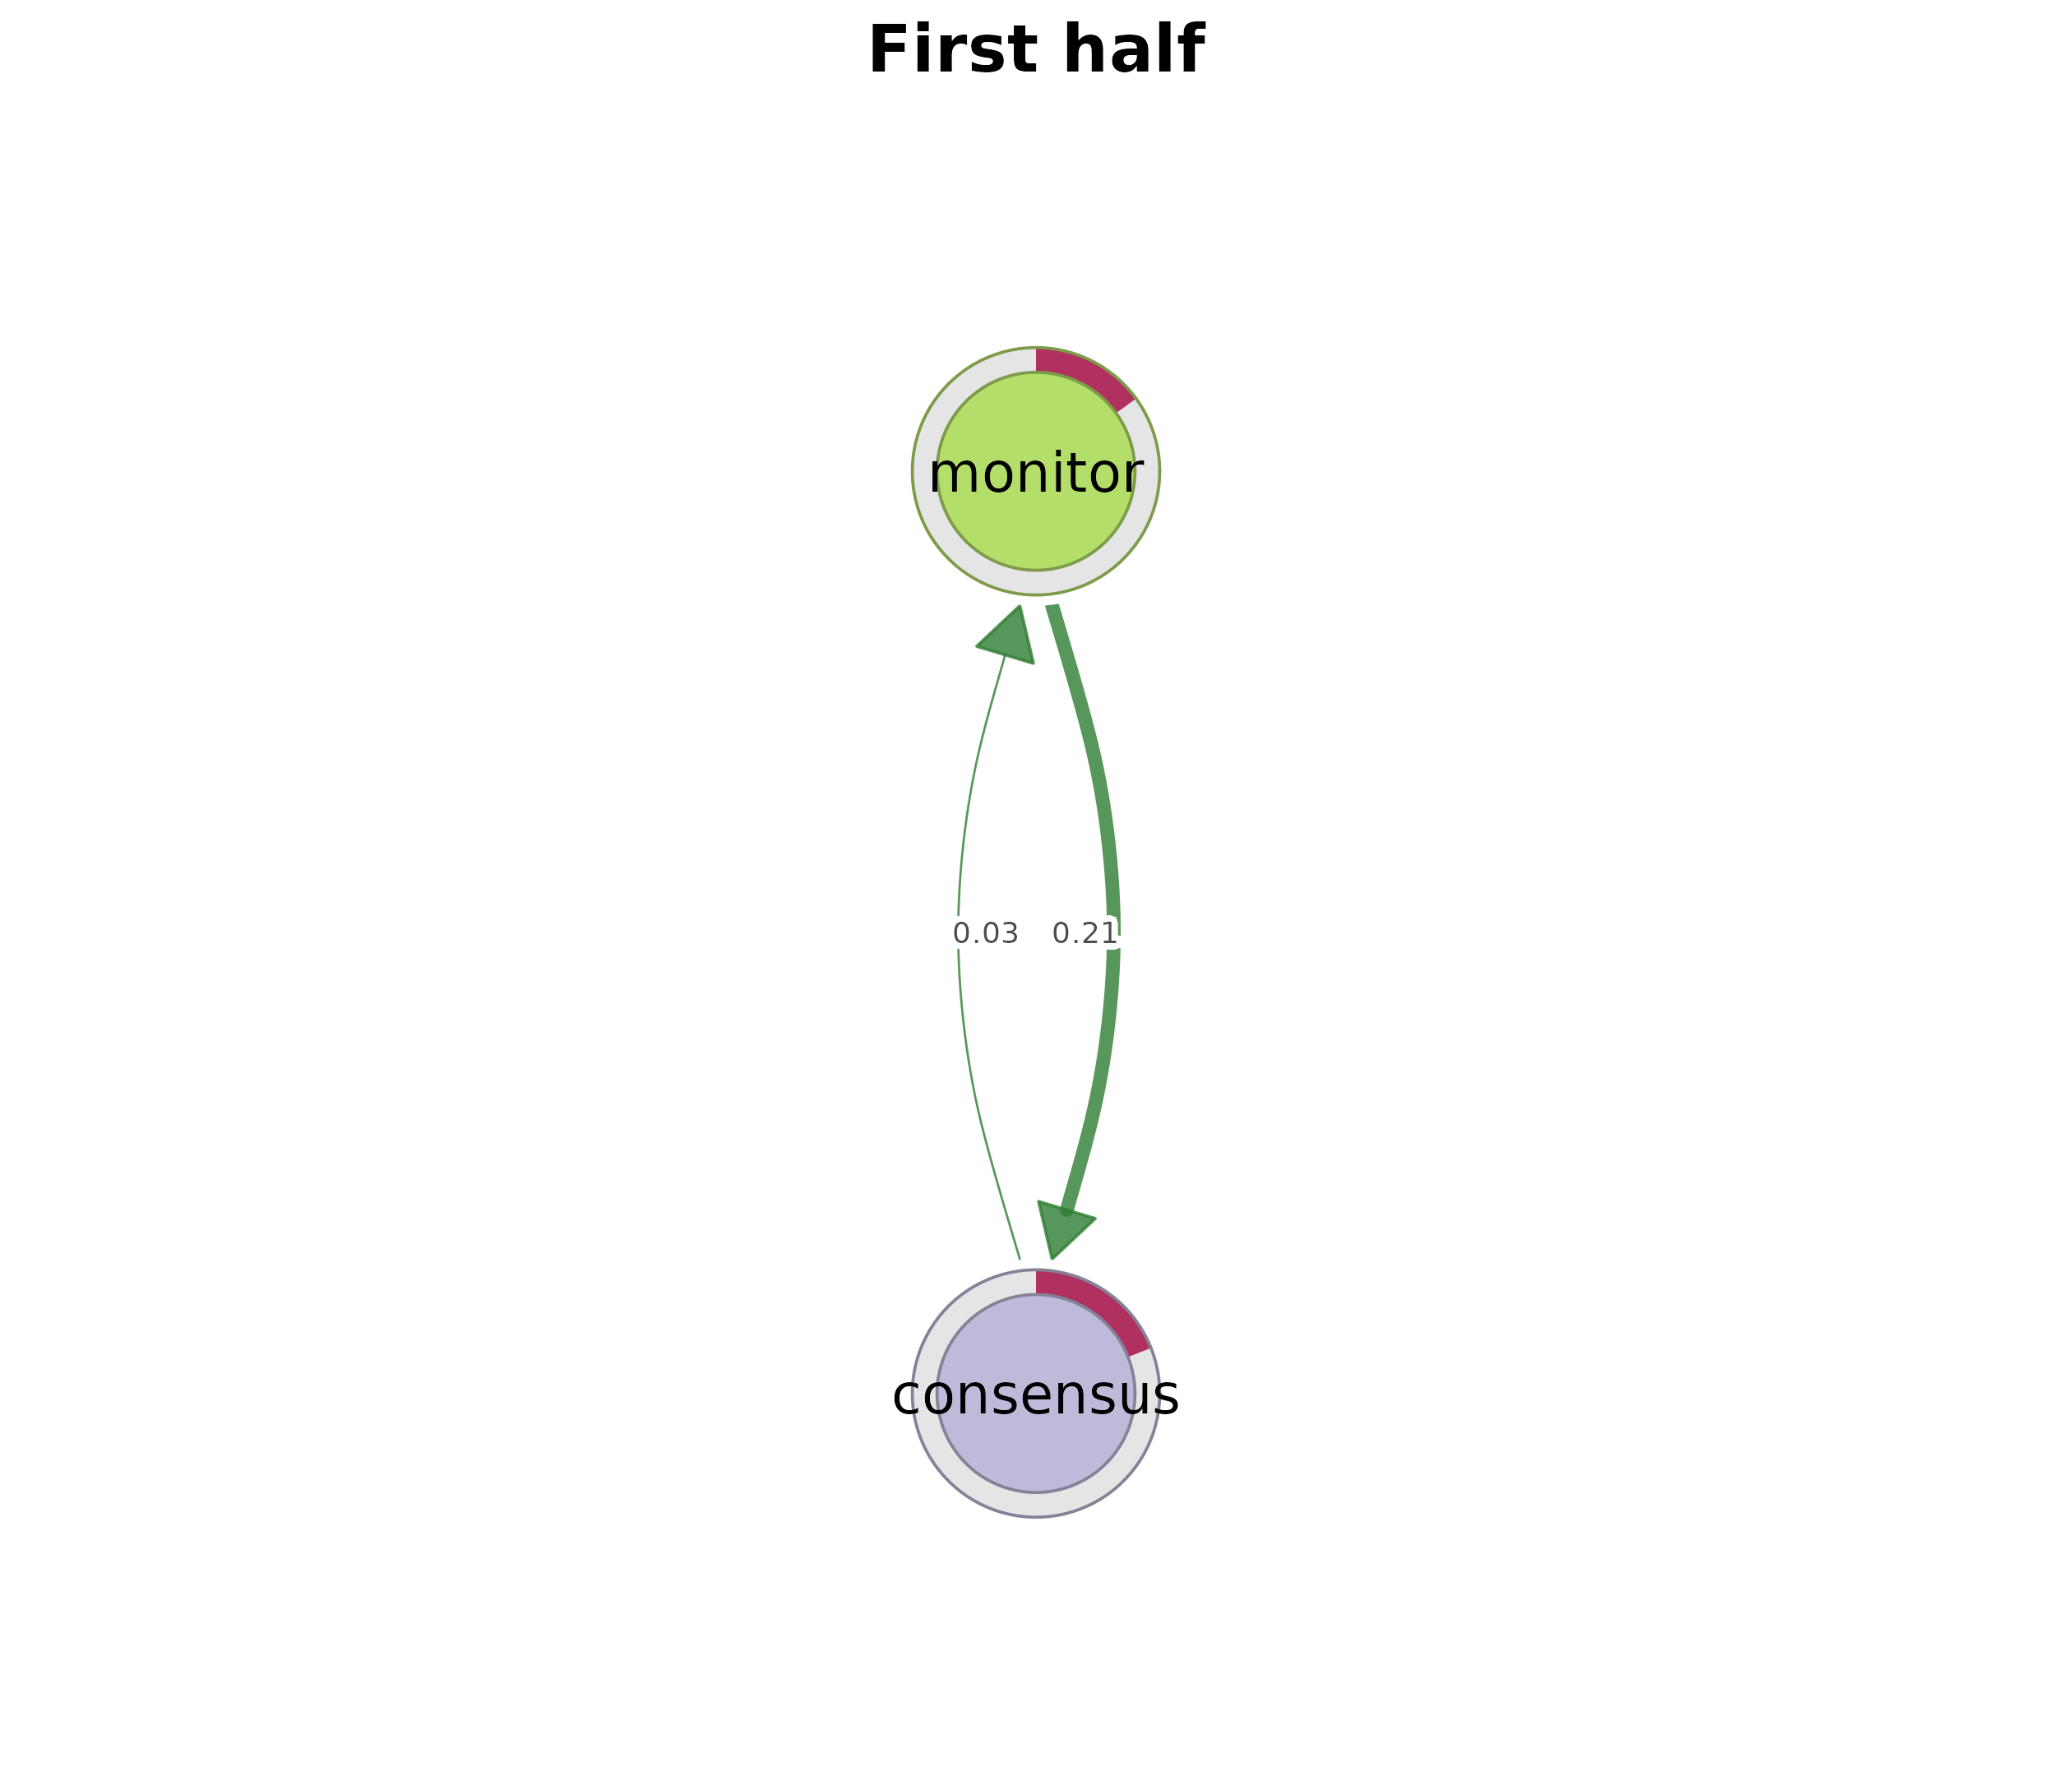
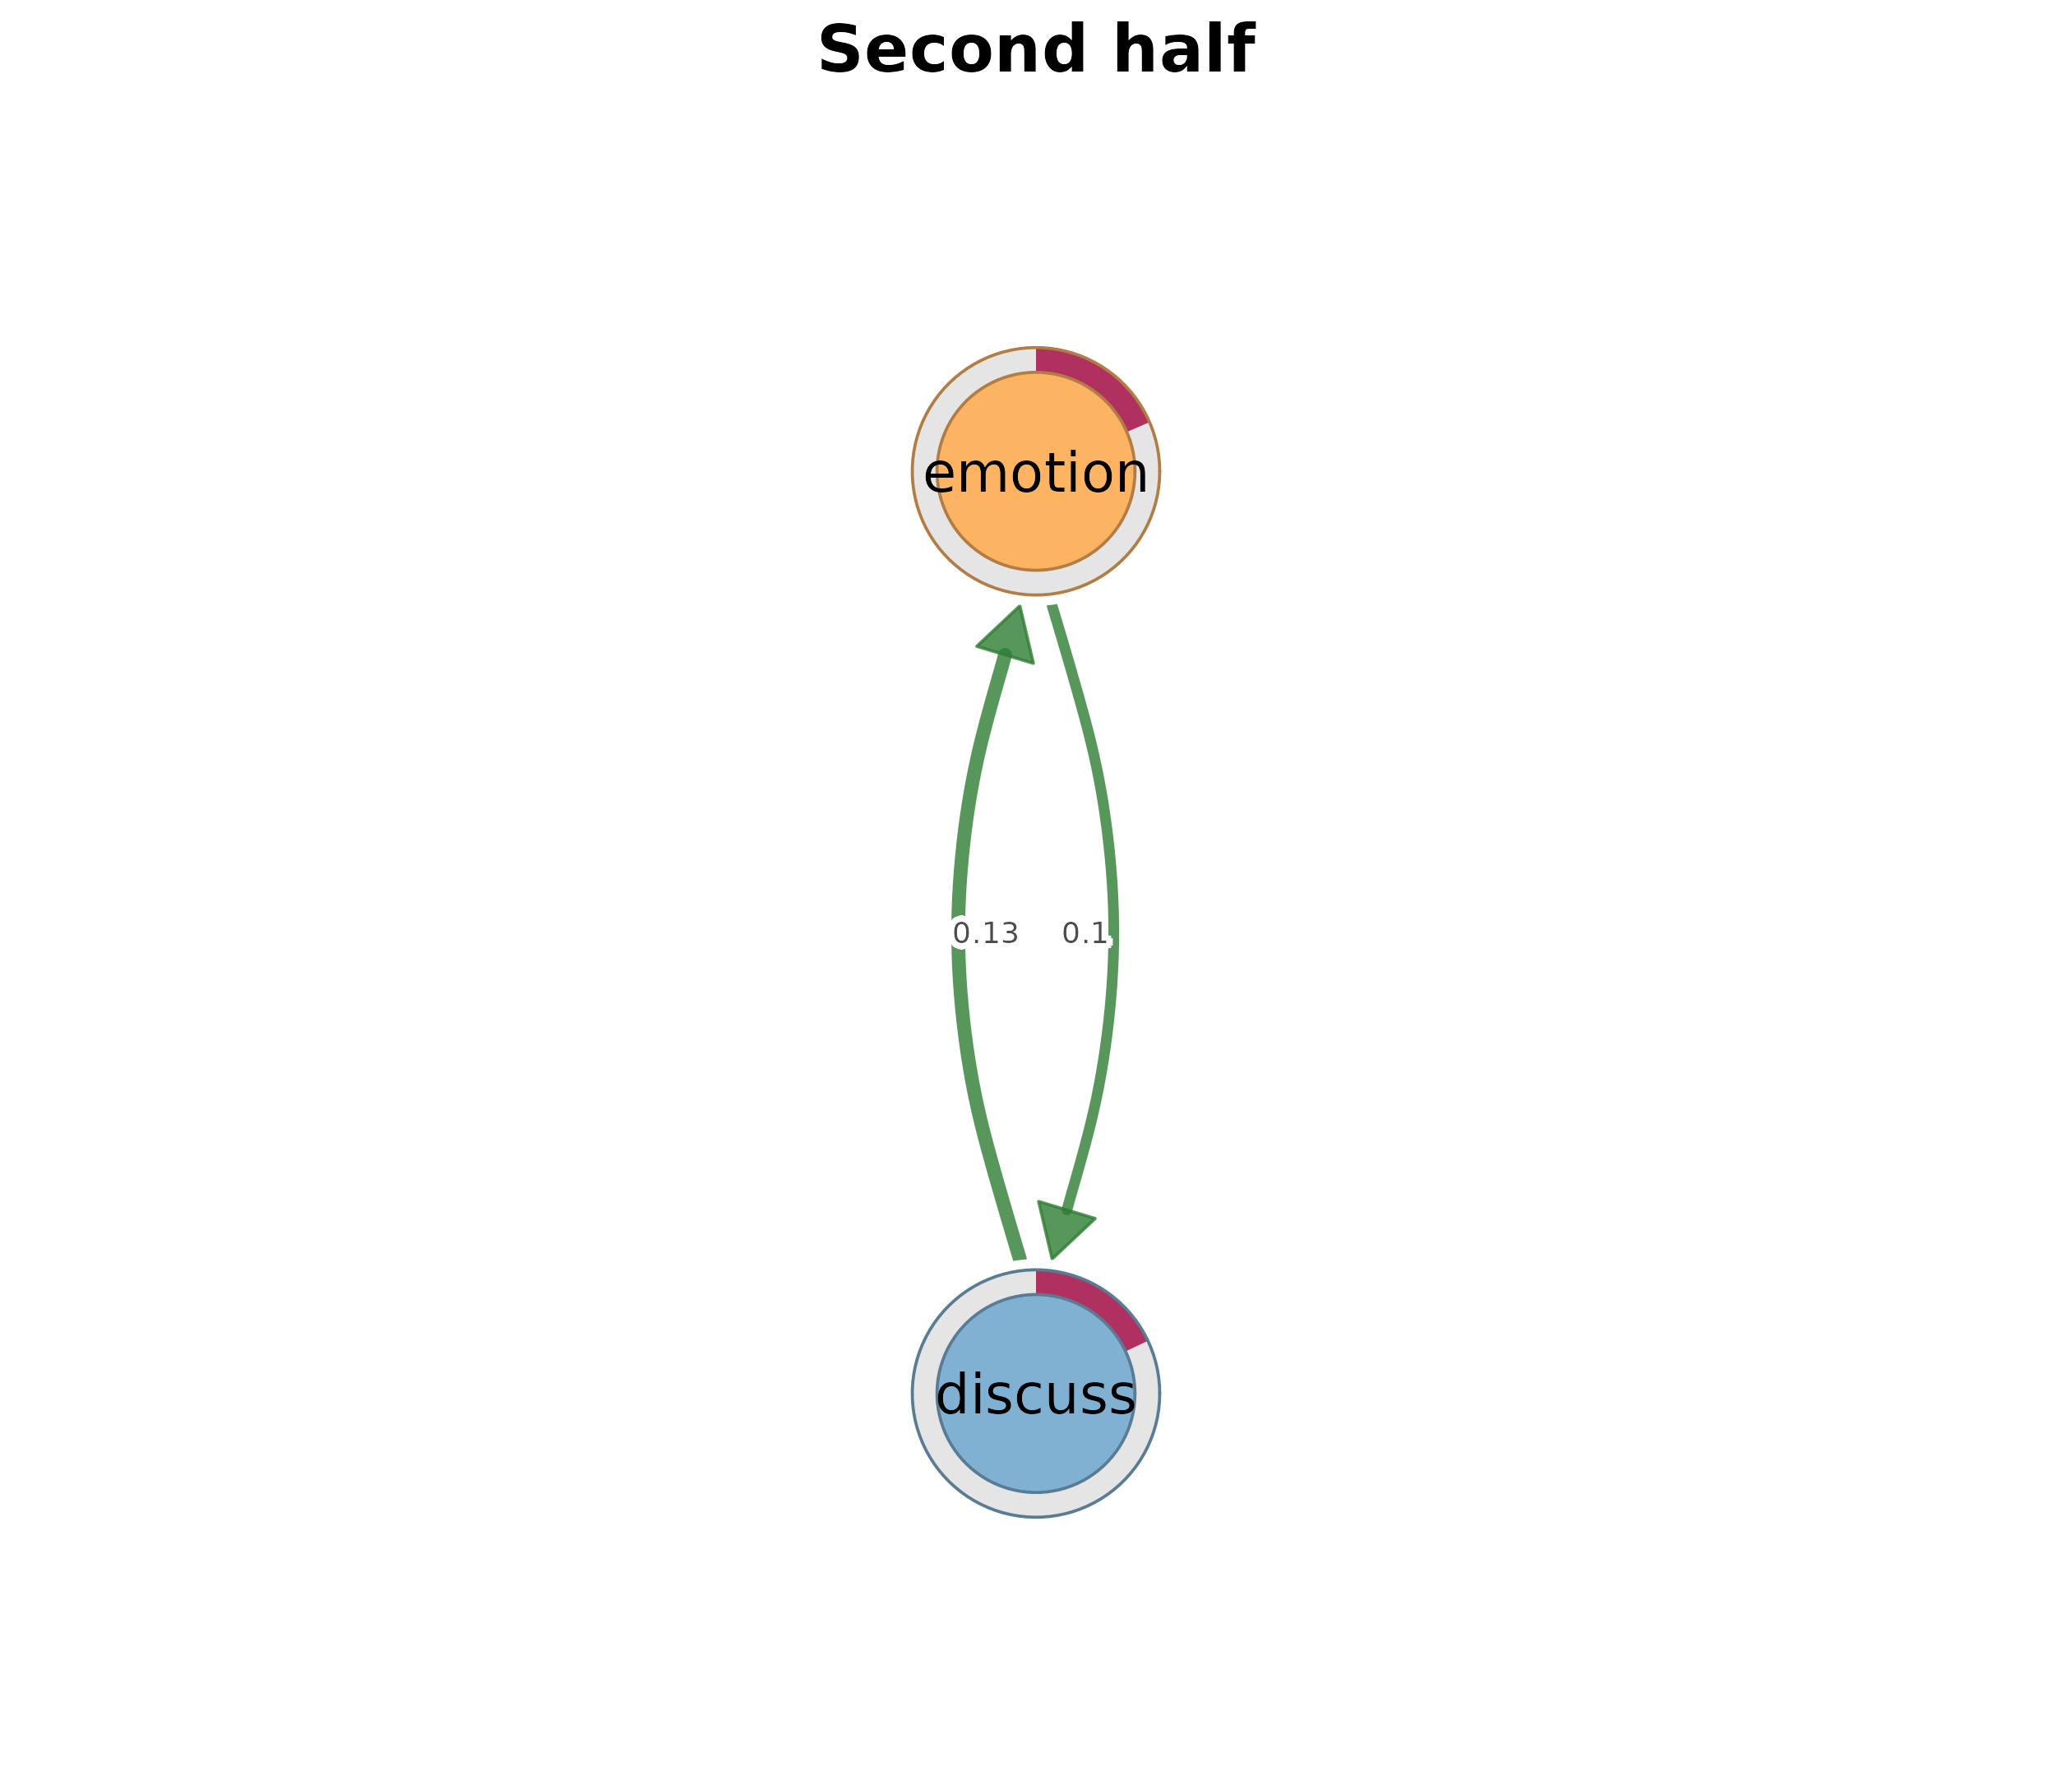
Difference networks
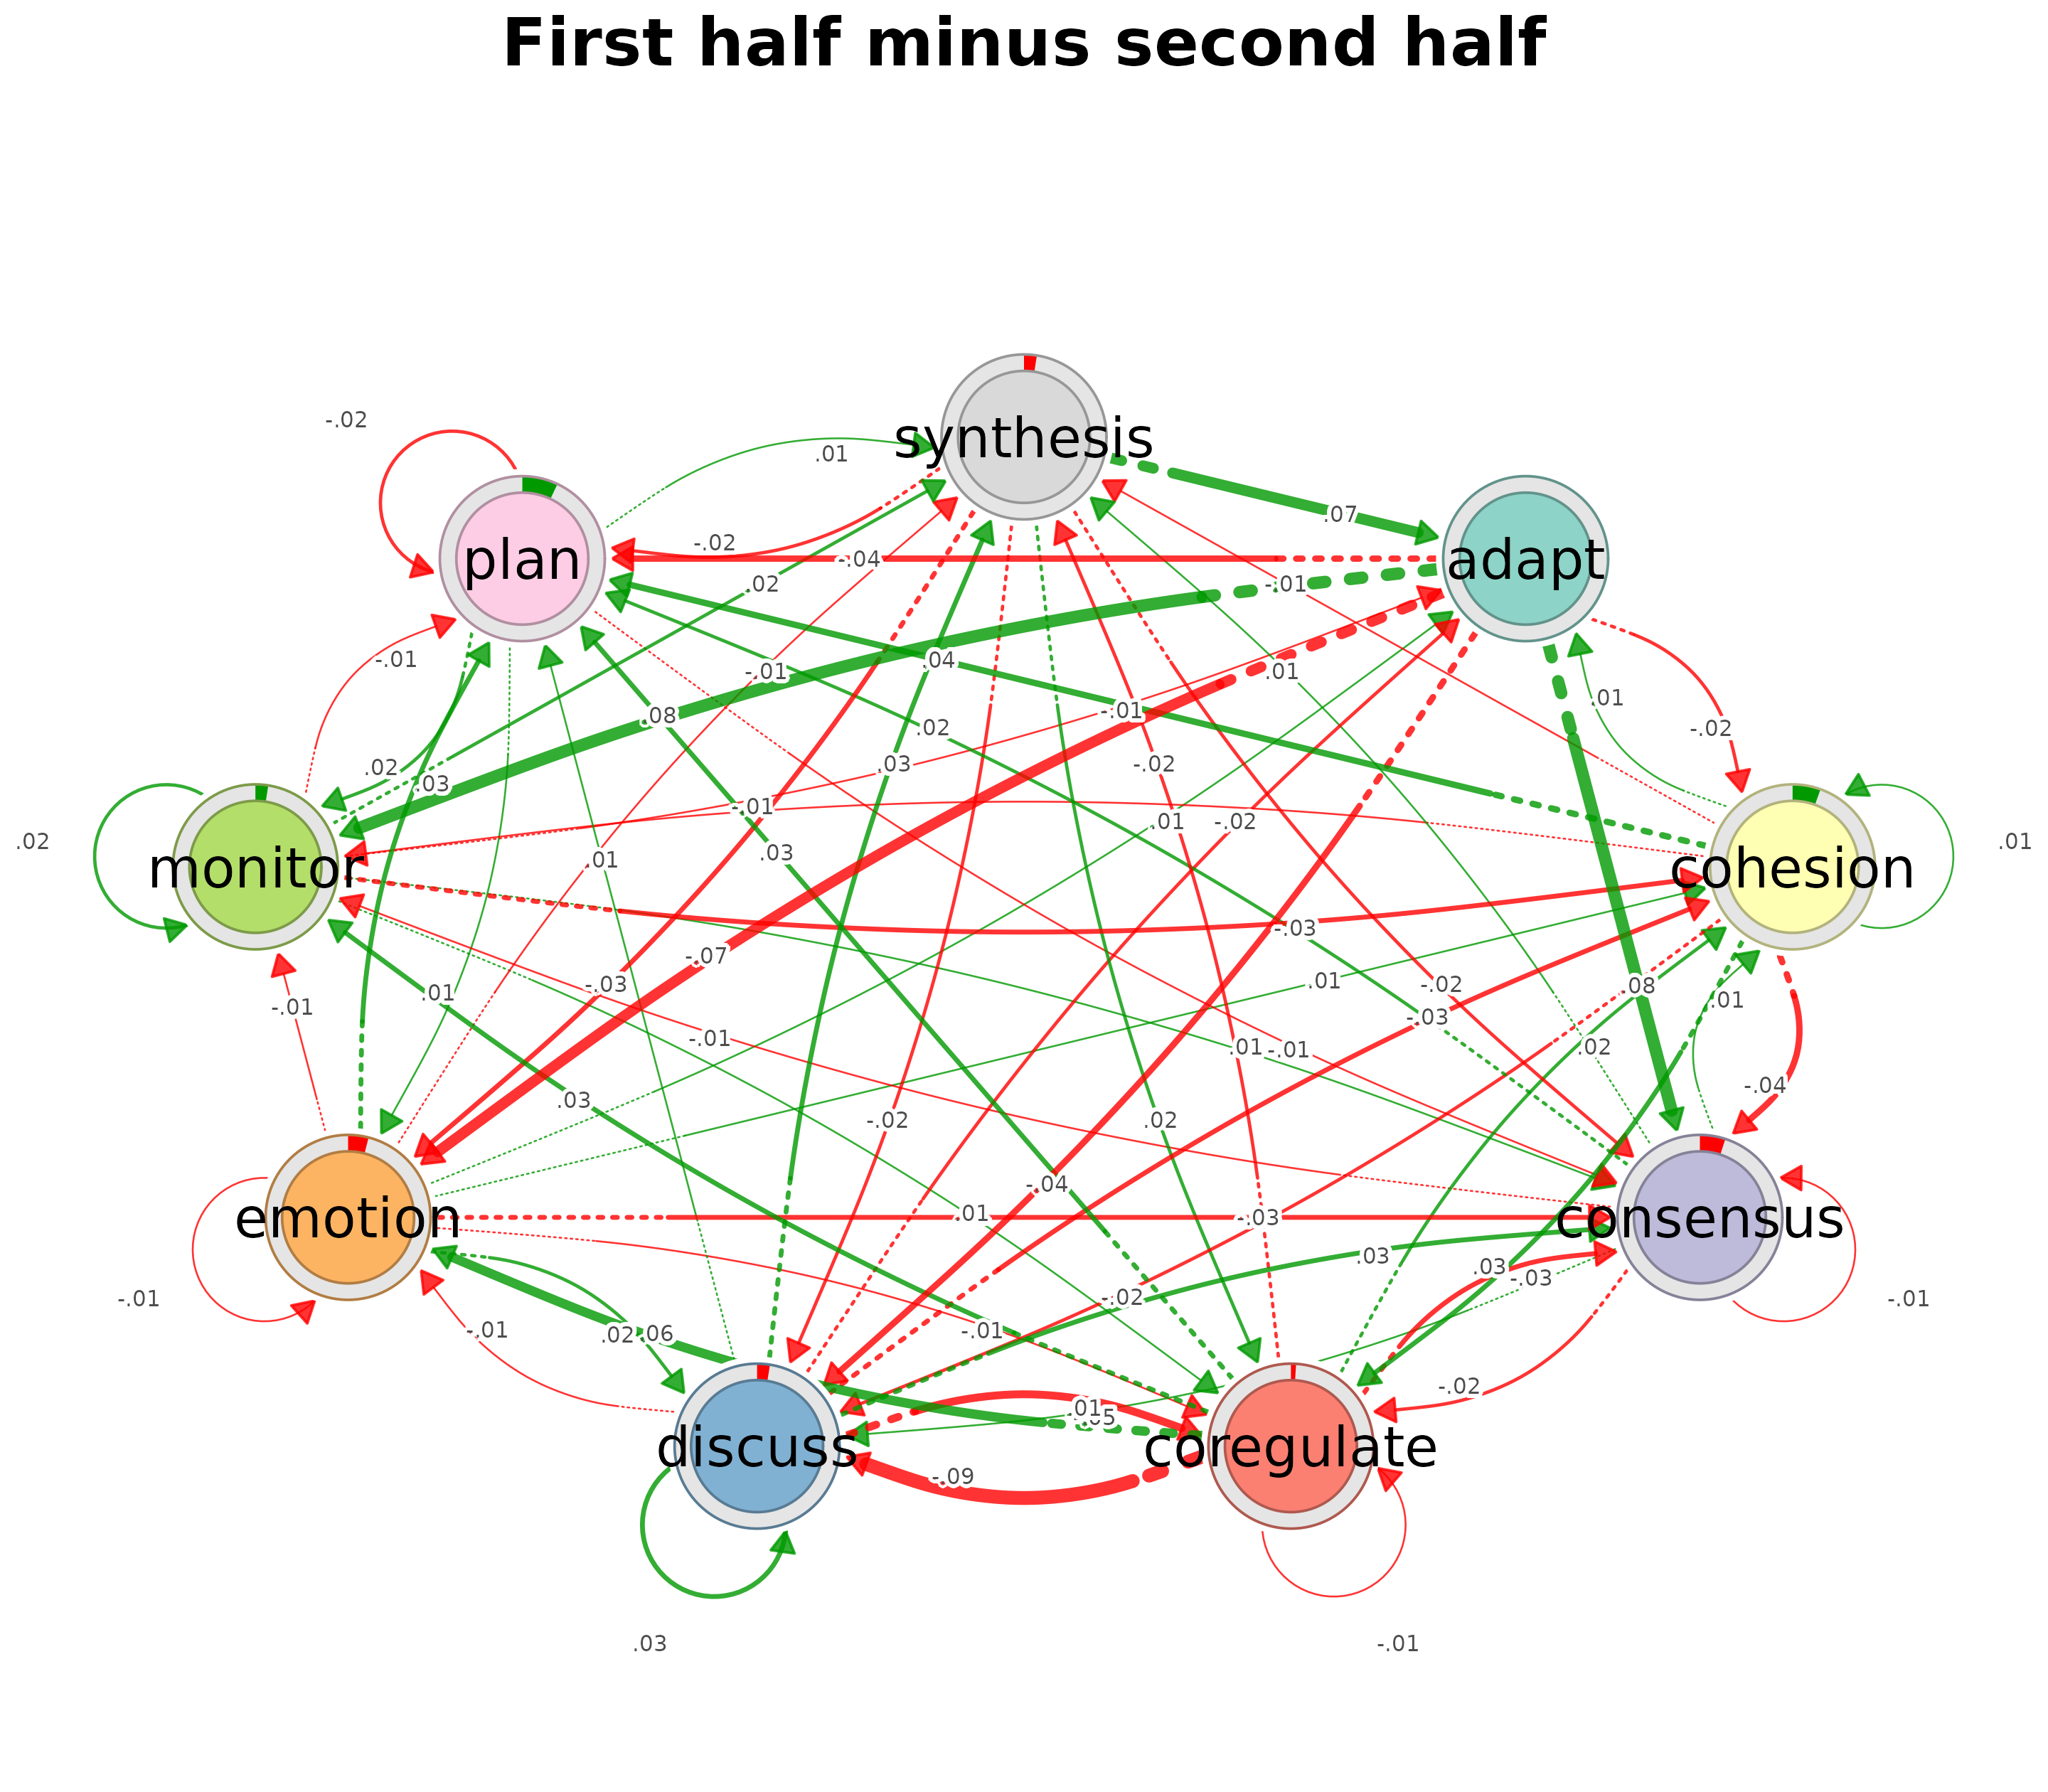
Exercises plot_compare.tna() and
plot_compare.group_tna(), both of which delegate to
cograph::plot_compare().
tna::plot_compare(
  model_first,
  model_second,
  title = "First half minus second half"
)
tna::plot_compare(group_models)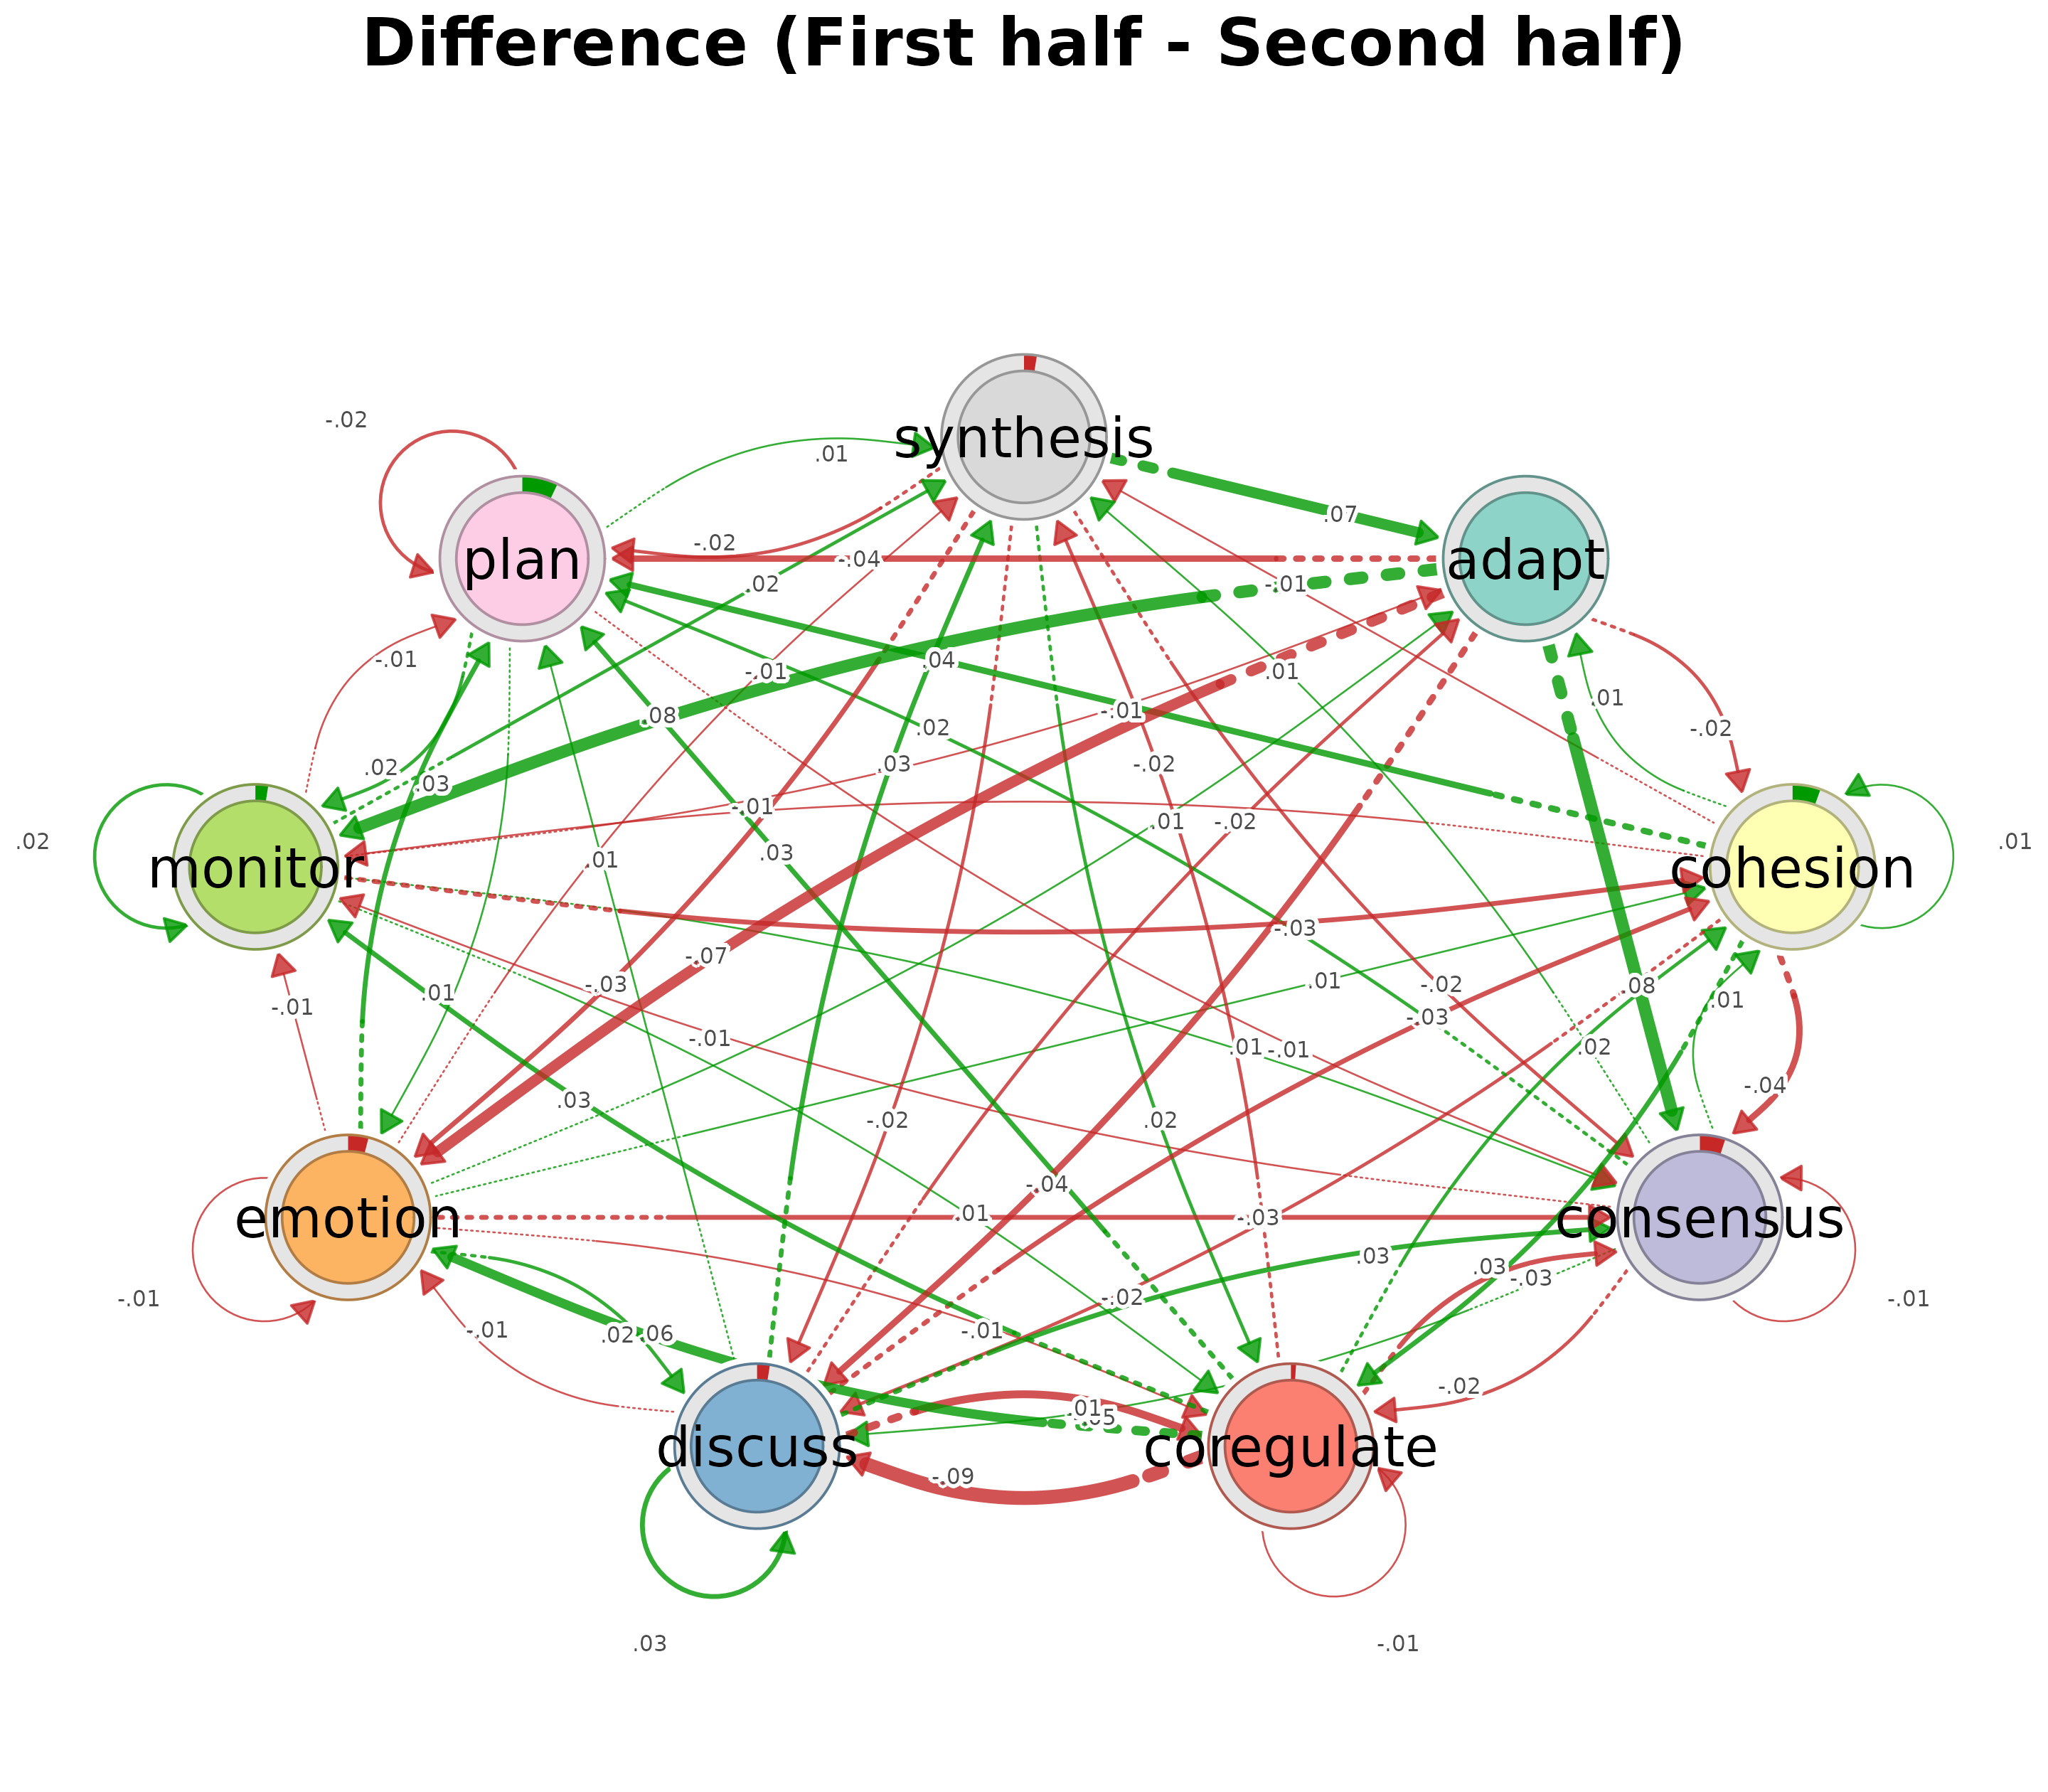
TNA comparison object
Exercises every mode of plot.tna_comparison().
plot(comparison_result, type = "heatmap")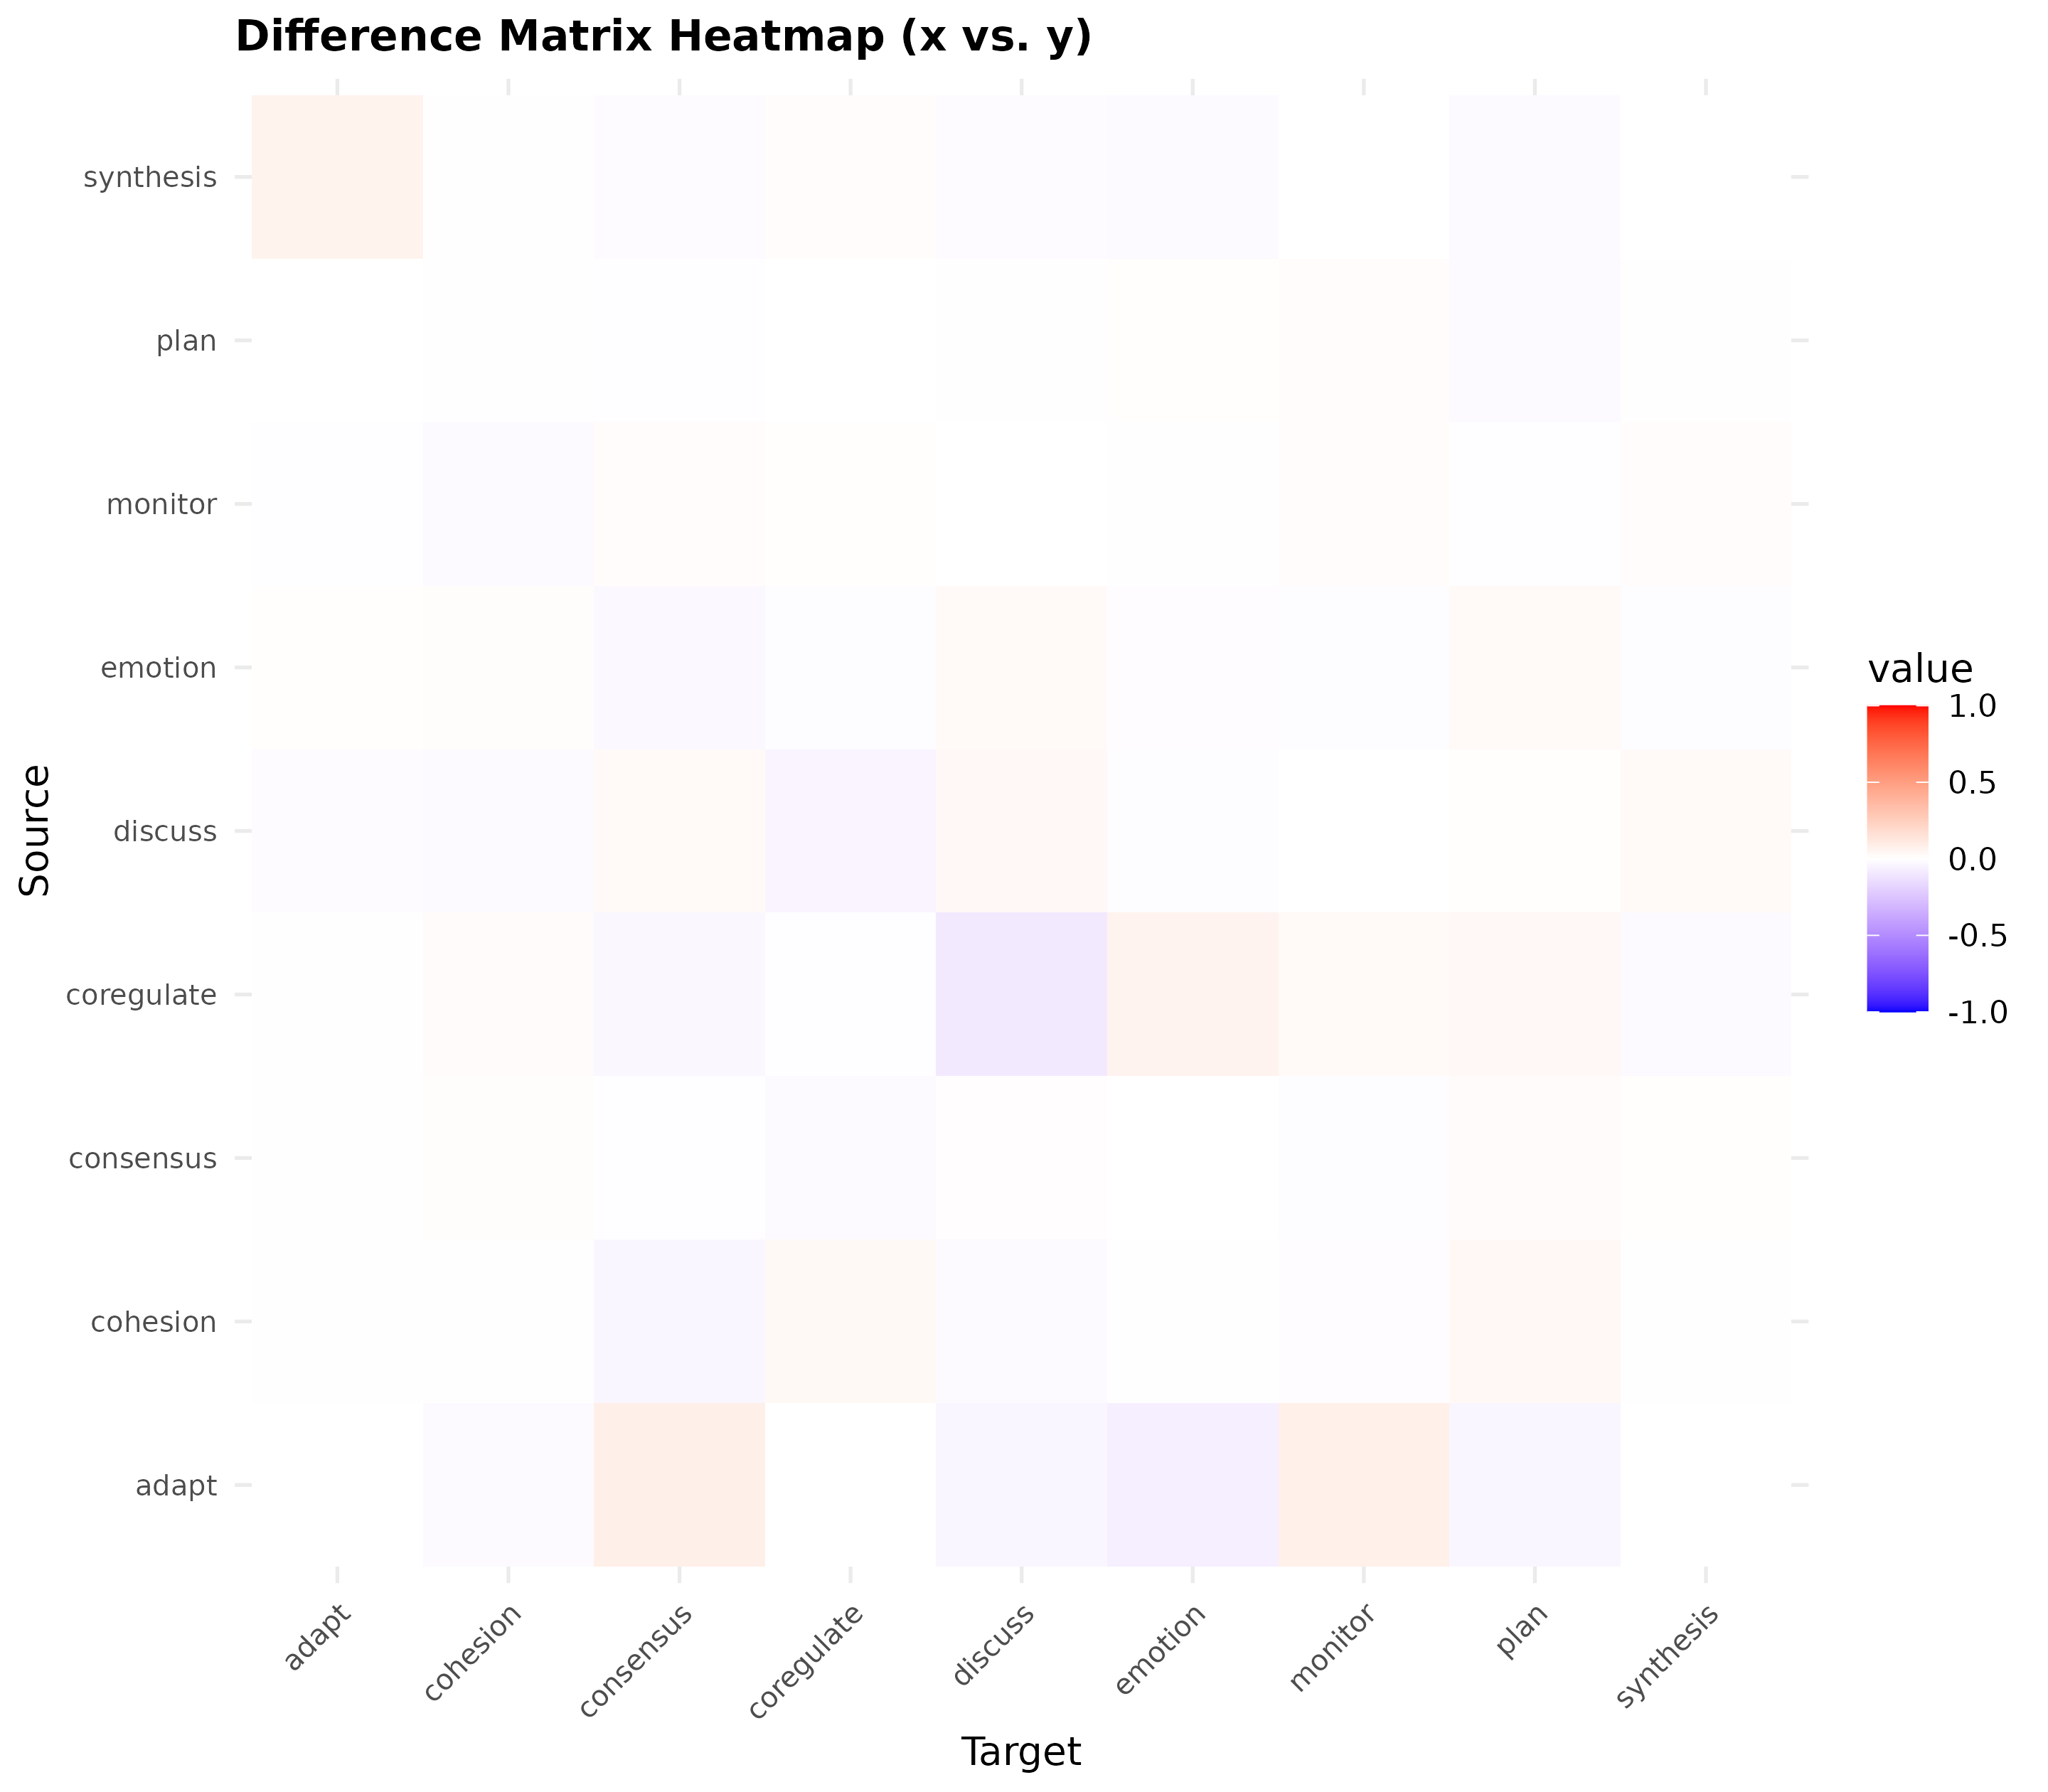
plot(comparison_result, type = "scatterplot")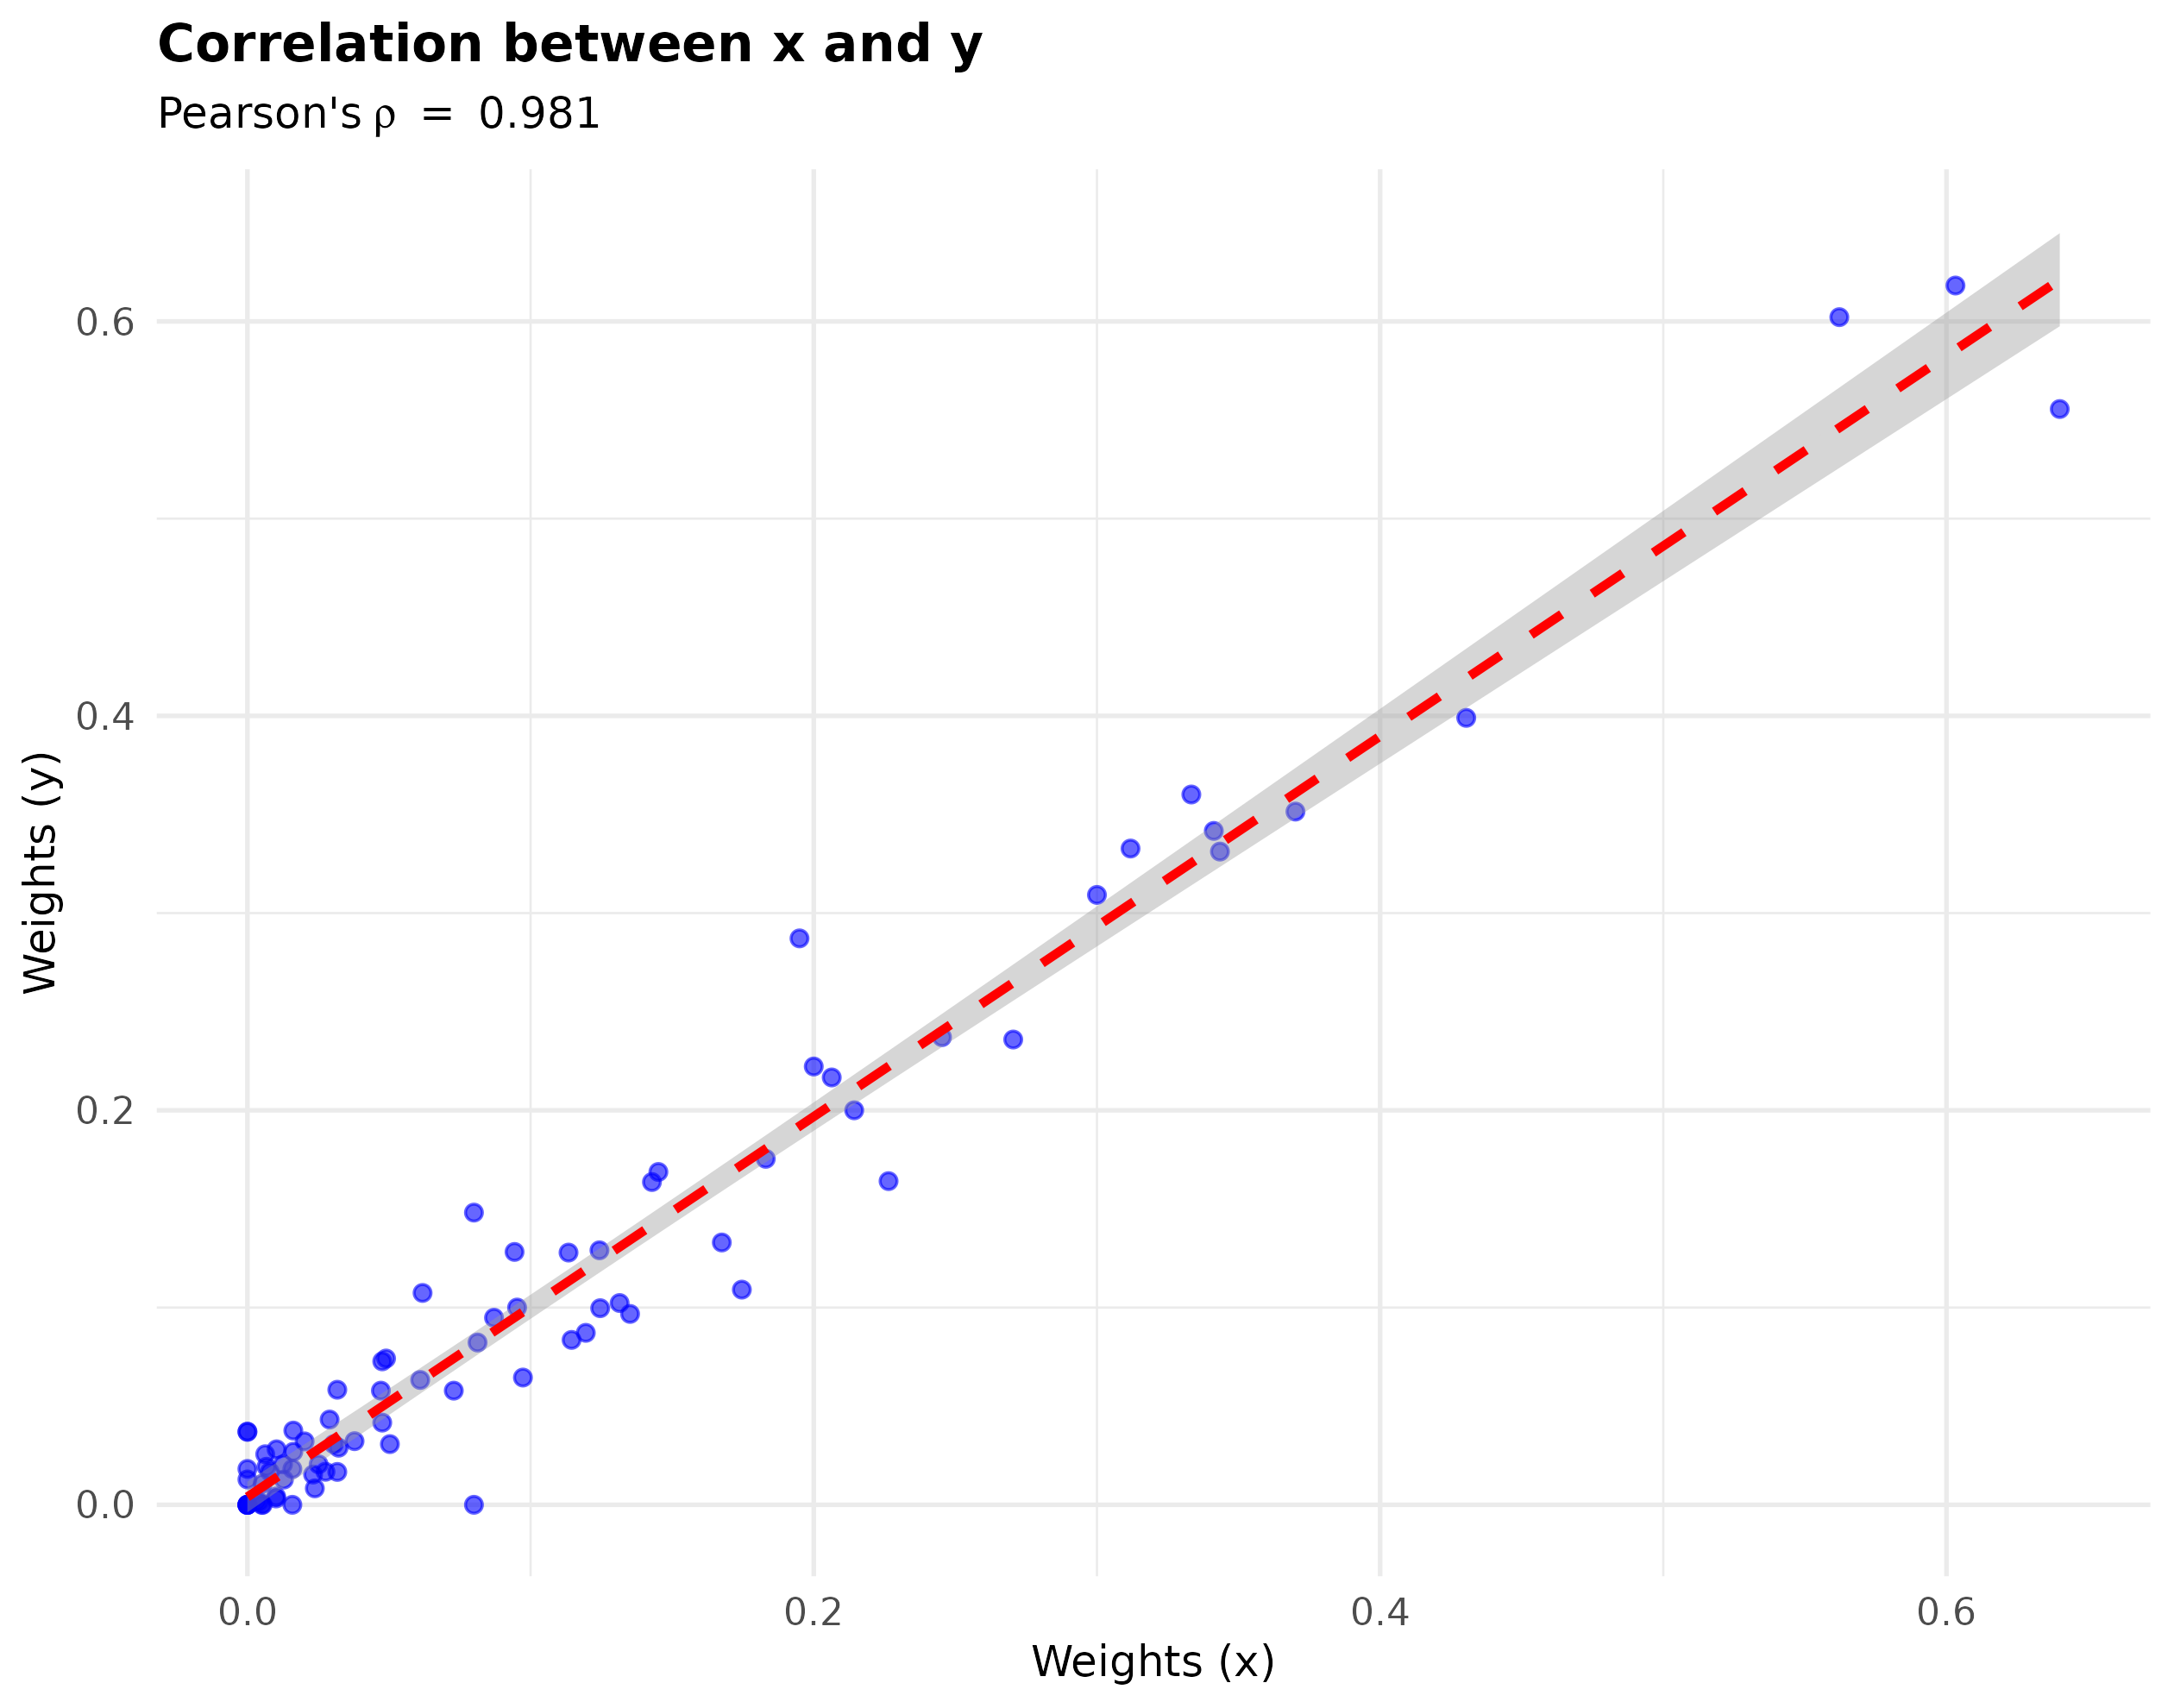
plot(comparison_result, type = "centrality_heatmap")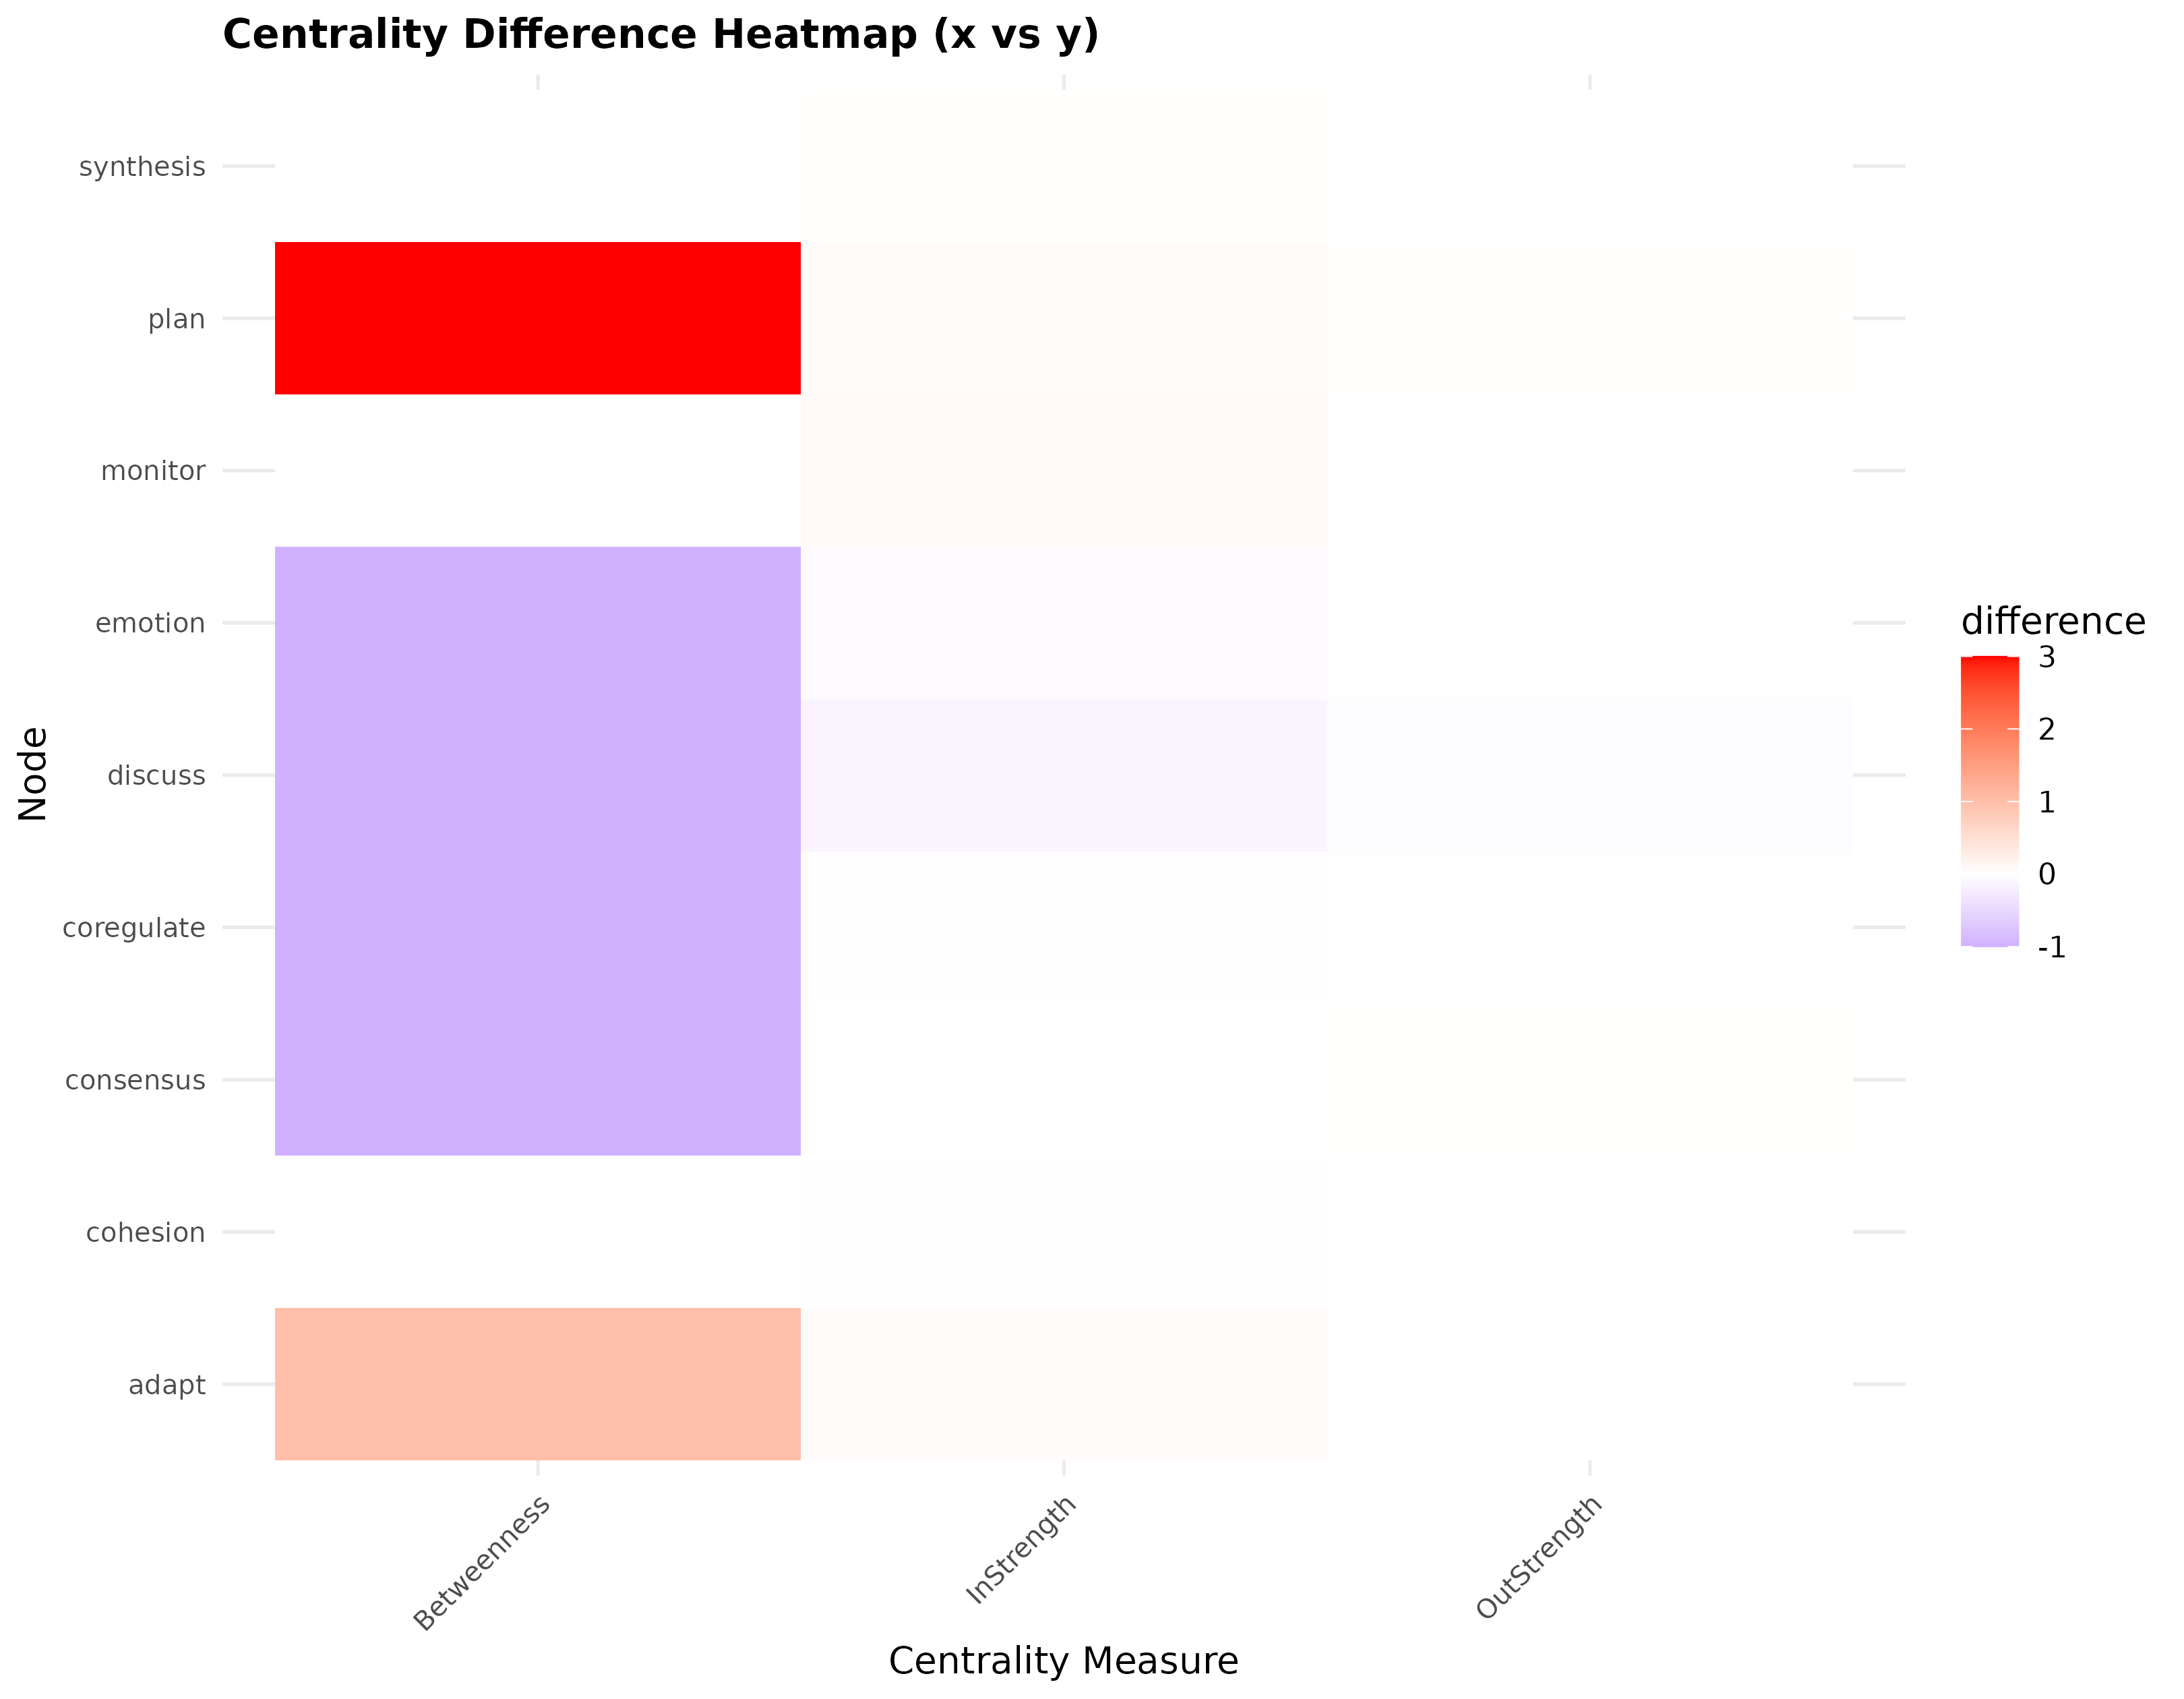
plot(comparison_result, type = "weight_density")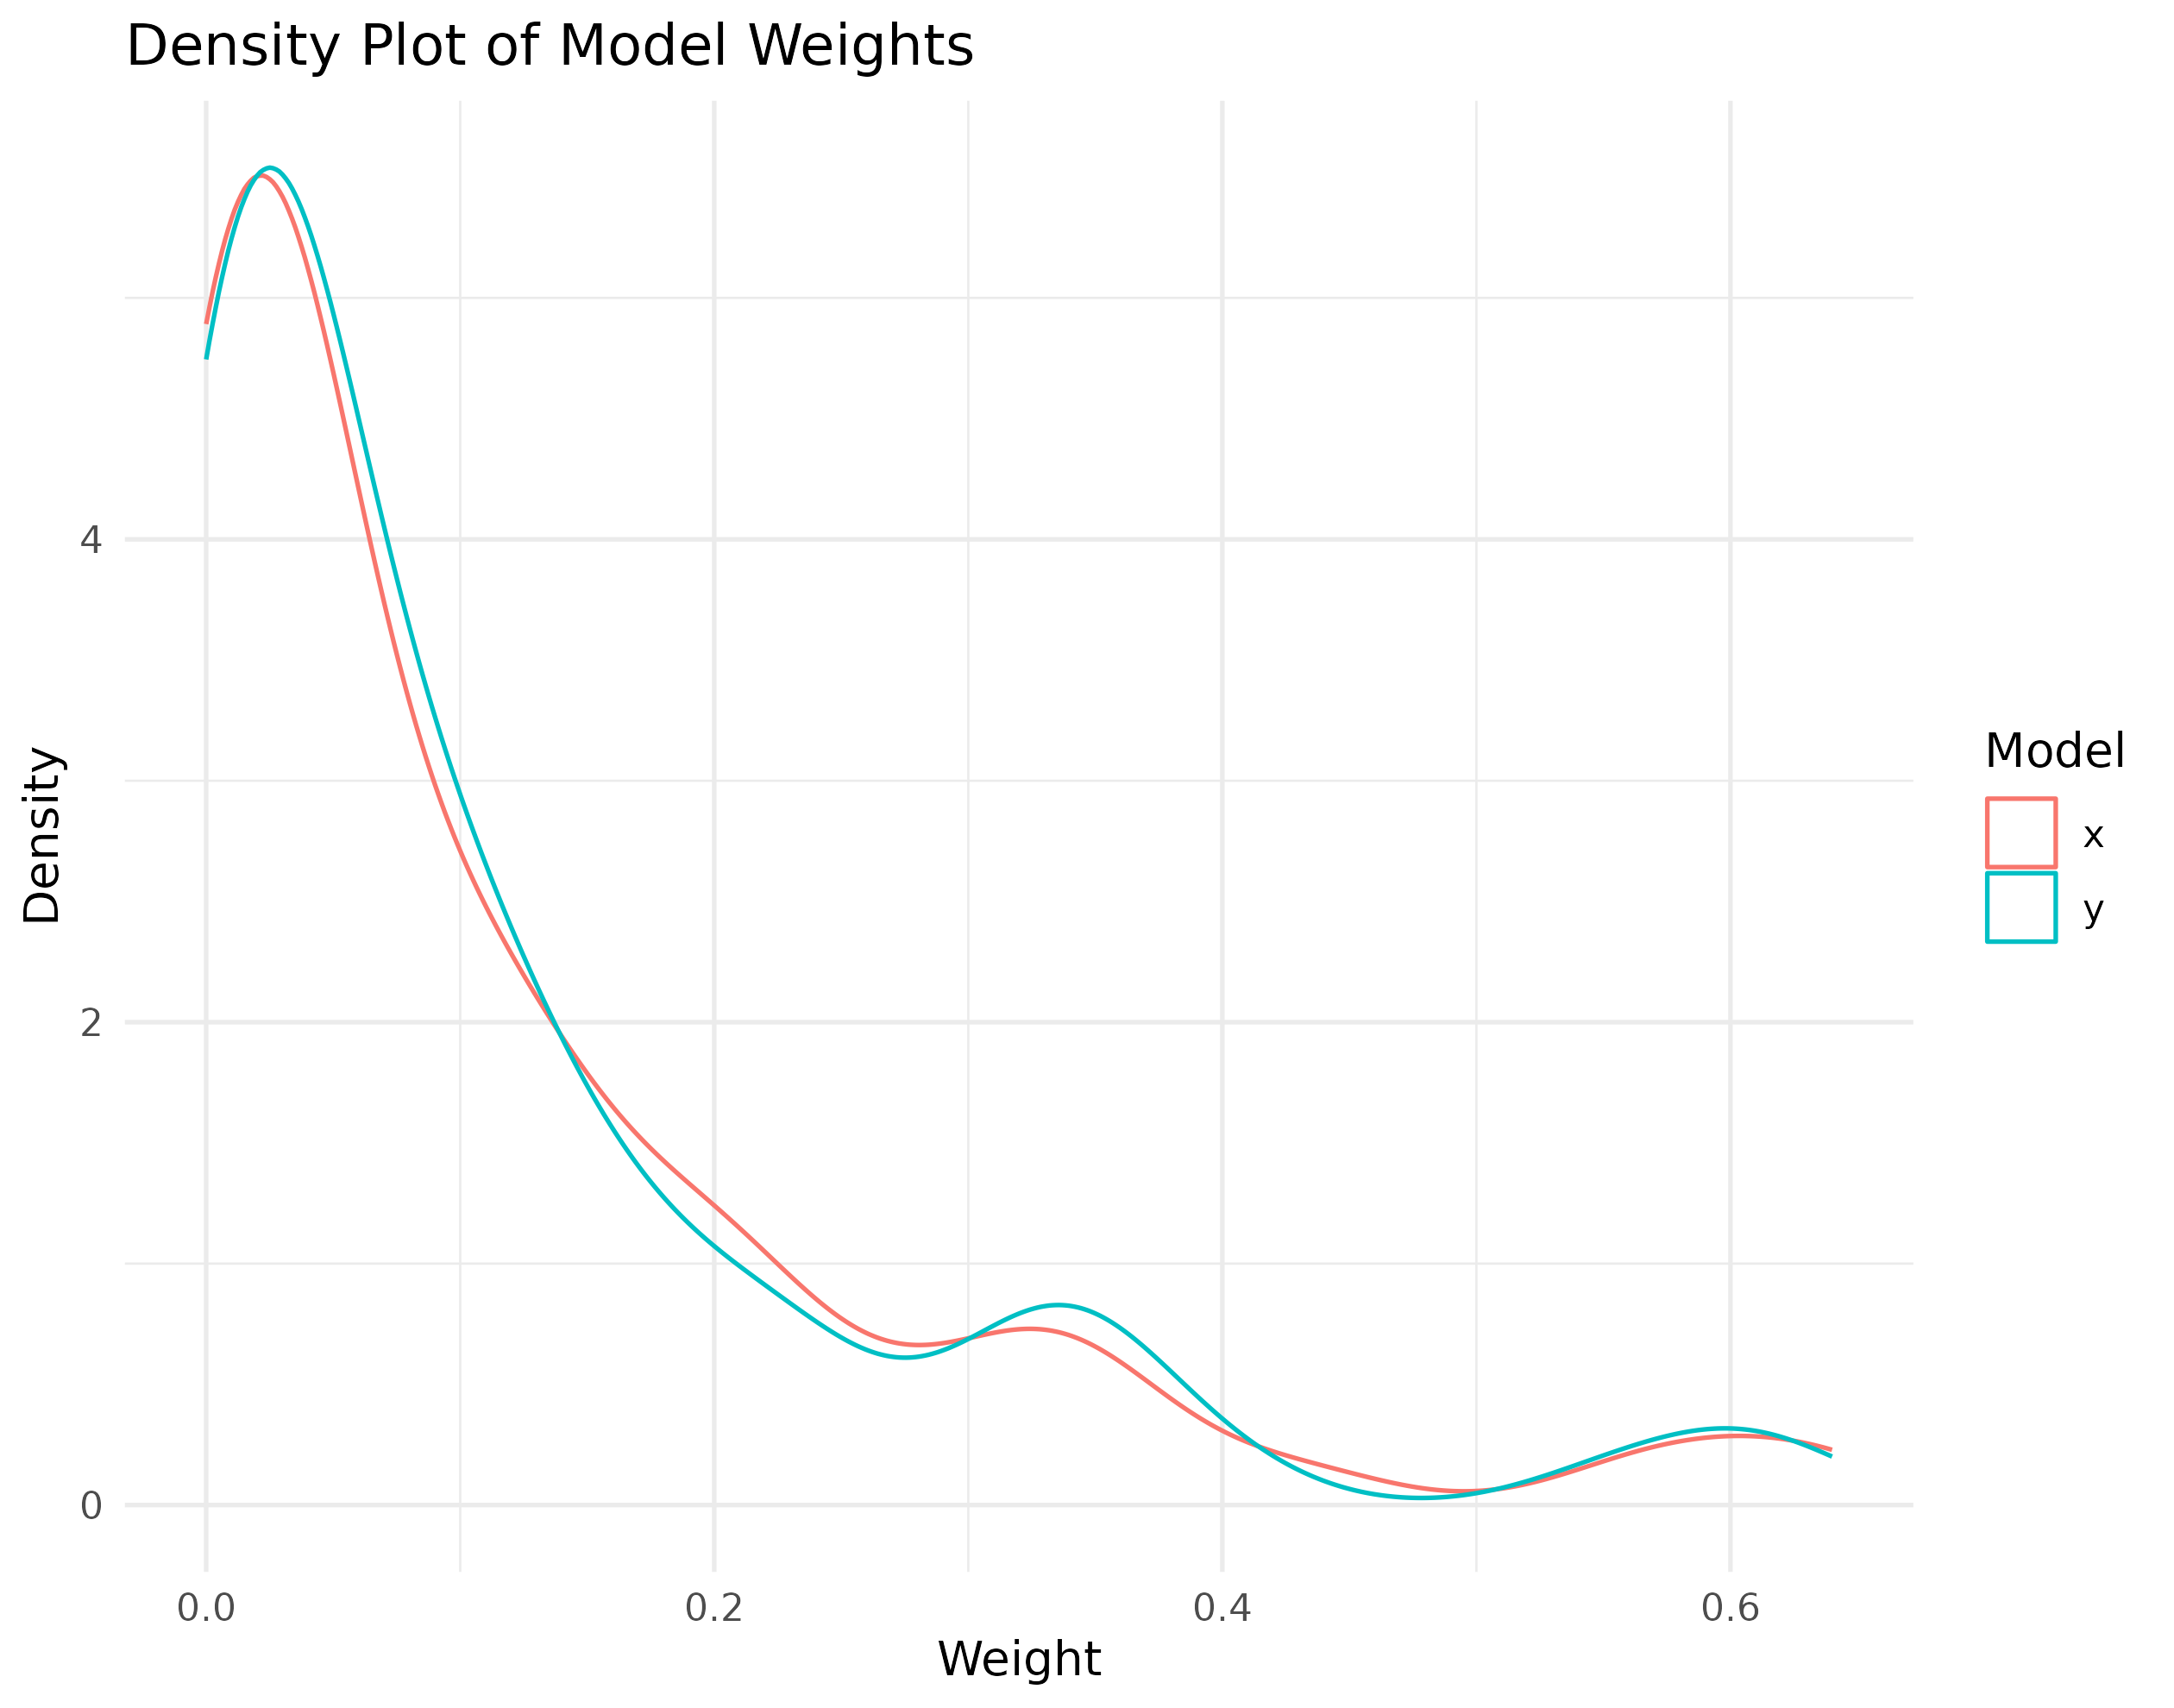
Sequence comparison
Exercises plot.tna_sequence_comparison().
plot(sequence_comparison_result, n = 10, cells = TRUE)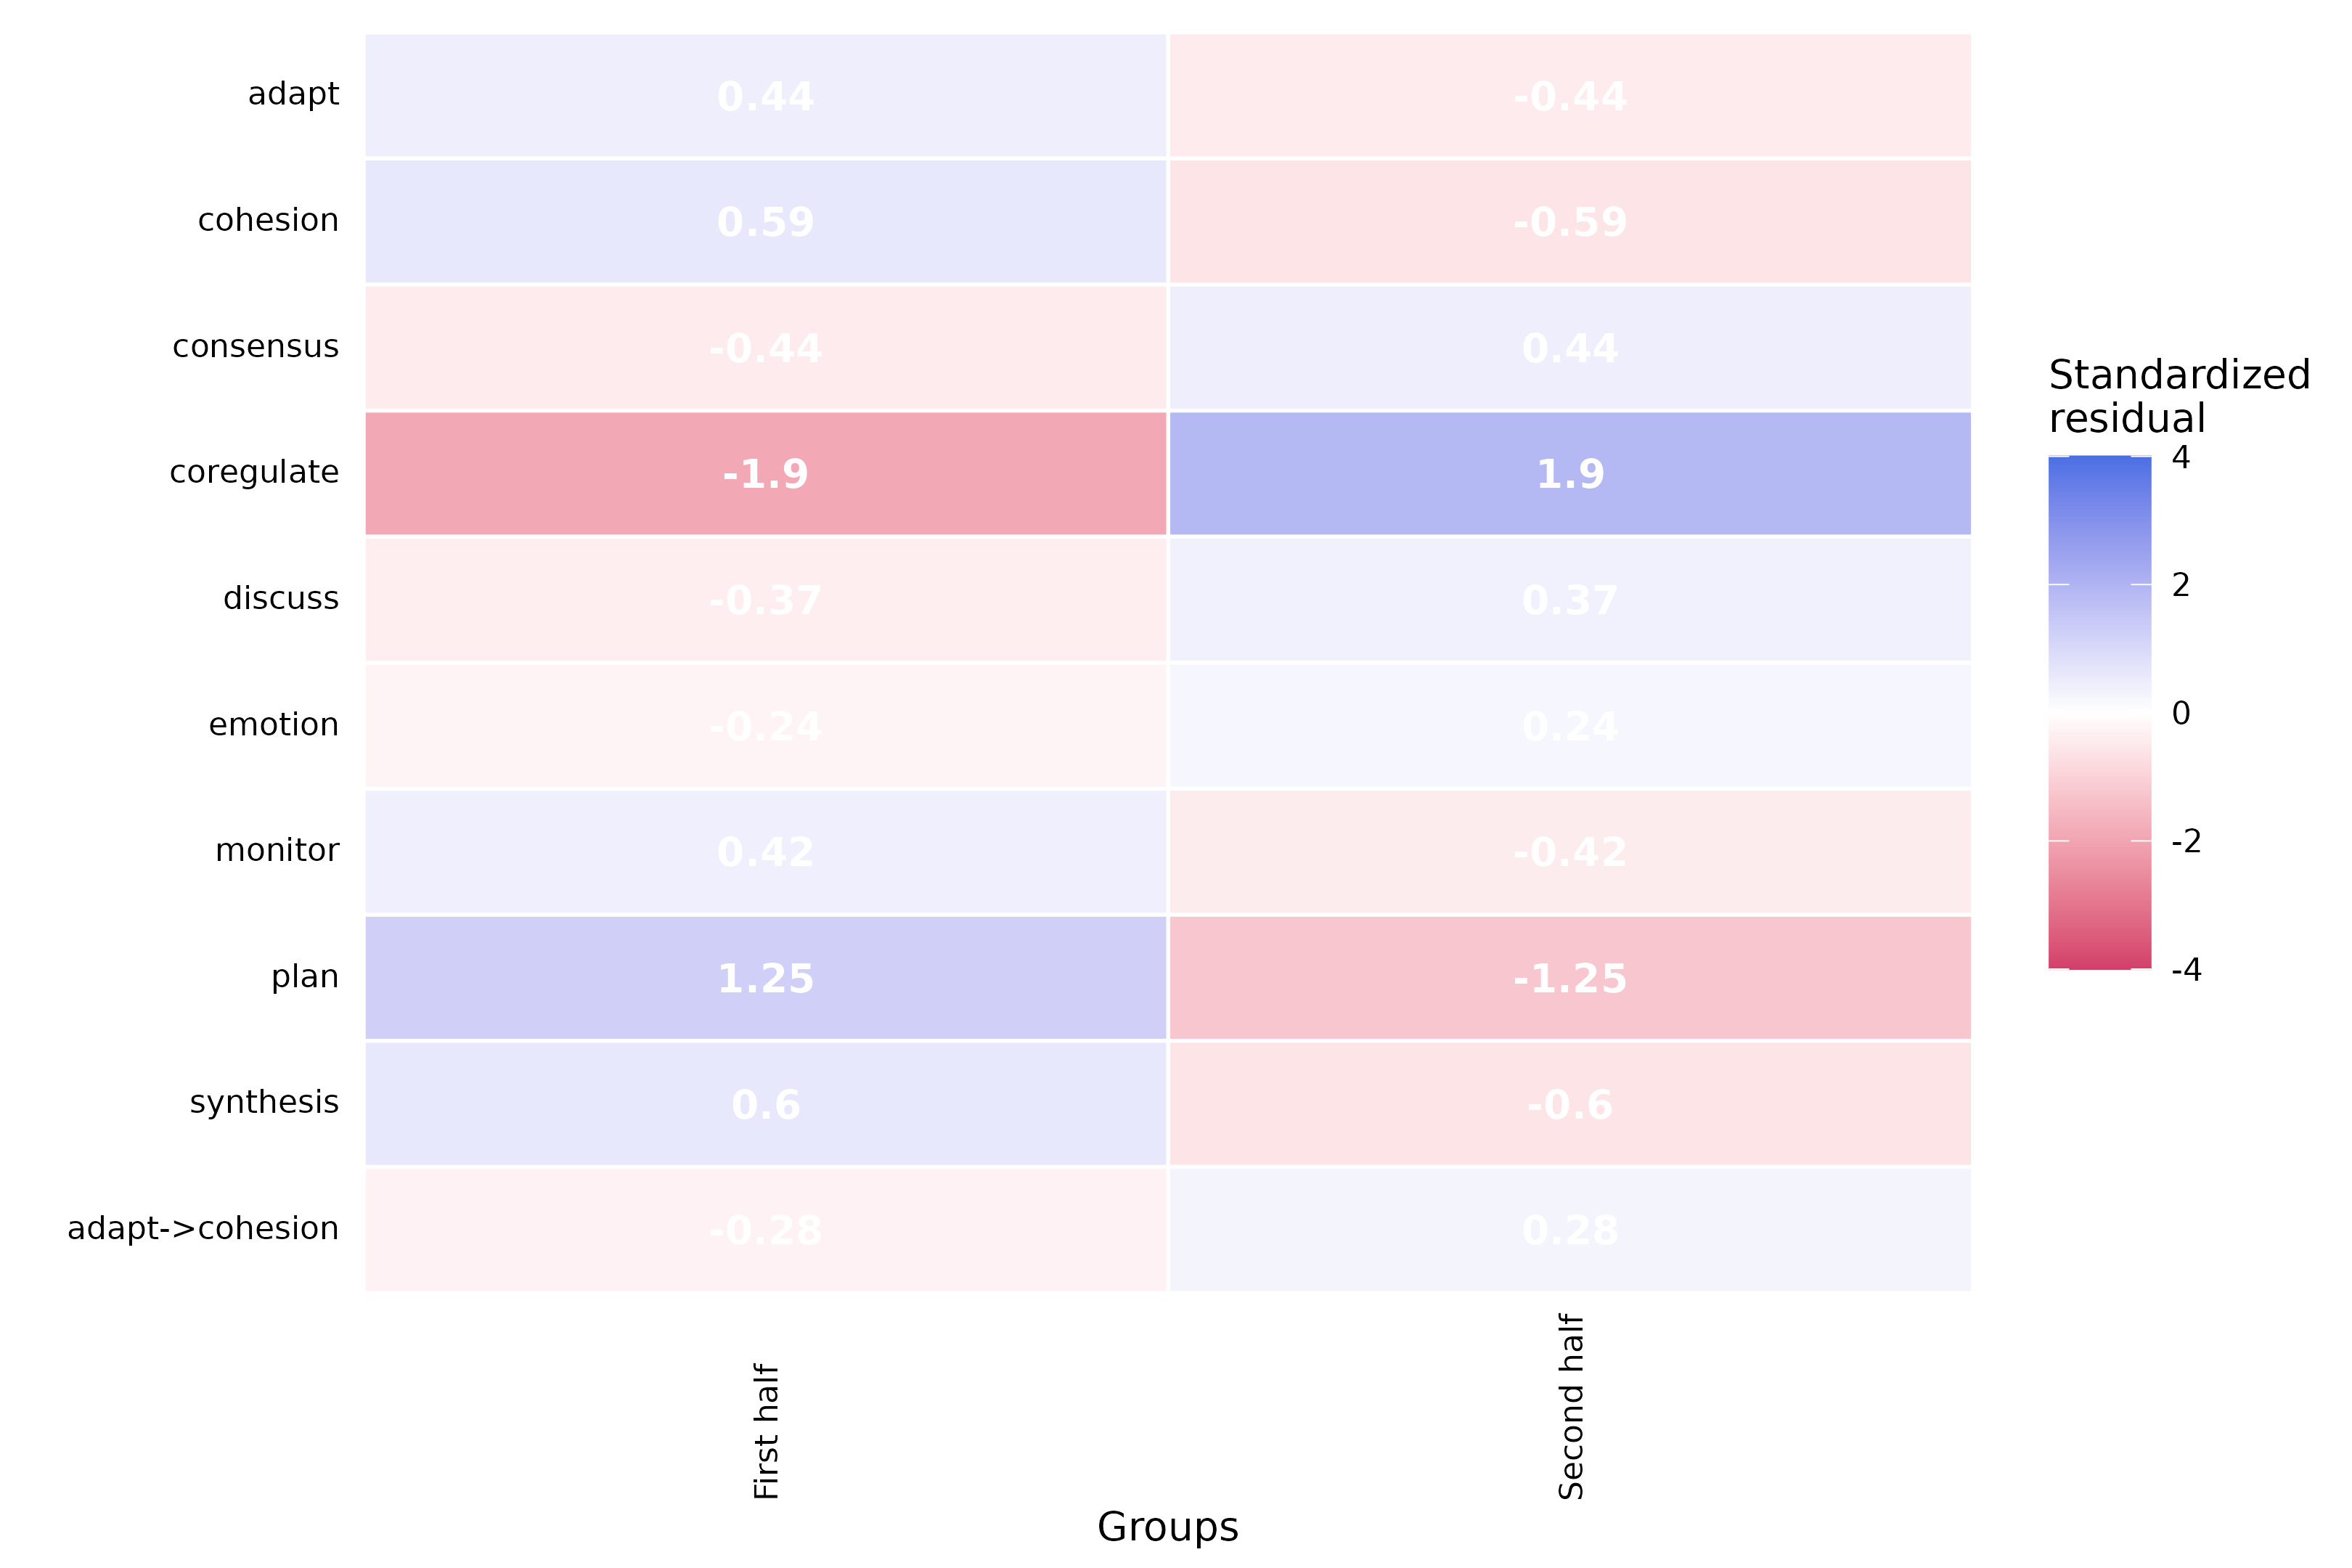
Build result
If this section is visible, every plotting chunk above completed without an error.
data.frame(
  status = "PASS",
  tna = as.character(utils::packageVersion("tna")),
  cograph = as.character(utils::packageVersion("cograph")),
  rendered_at = format(Sys.time(), tz = "UTC", usetz = TRUE)
)
#>   status   tna cograph             rendered_at
#> 1   PASS 1.3.1   2.7.8 2026-10-12 13:29:51 UTC