Re-renders the mosaic plot from a fitted mosaic_analysis object using
the stored contingency table and residuals, so styling can be changed without
re-running the statistical test. Any styling argument accepted by
mosaic_analysis (e.g. plot_style, tile_label,
col_label_side, legend_size) can be overridden via ...;
unspecified arguments keep the values from the original call.
Usage
# S3 method for class 'mosaic_analysis'
plot(x, ...)
Arguments
- x
A
mosaic_analysisobject.- ...
Styling overrides (see
mosaic_analysis).
Value
Invisibly, the plot object (a ggplot for the flat style). Called for its side effect of drawing the plot.
Examples
set.seed(1)
d <- data.frame(
a = sample(c("X", "Y", "Z"), 200, replace = TRUE),
b = sample(c("P", "Q"), 200, replace = TRUE)
)
res <- mosaic_analysis(d, "a", "b", min_count = 5, verbose = FALSE)
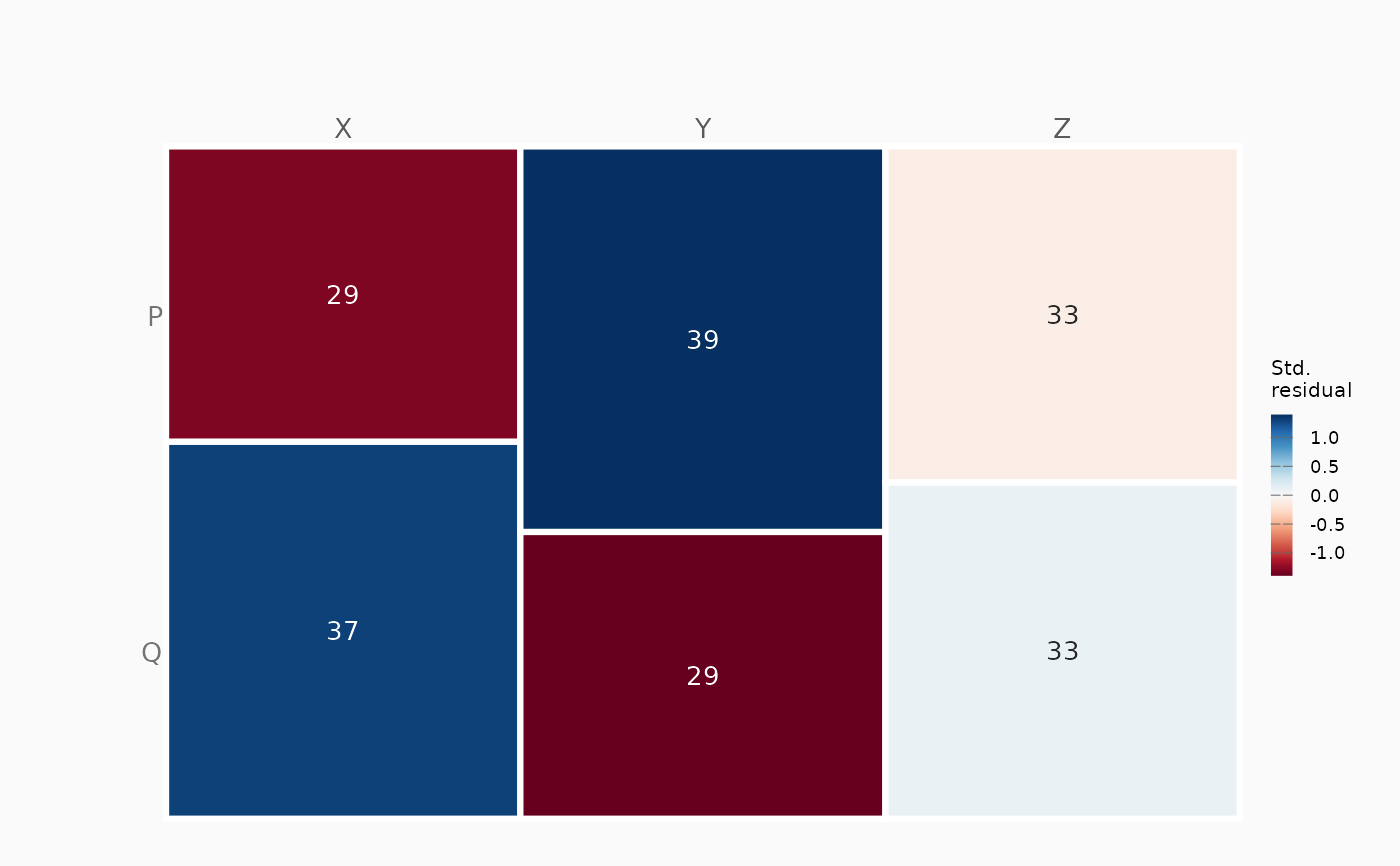 # \donttest{
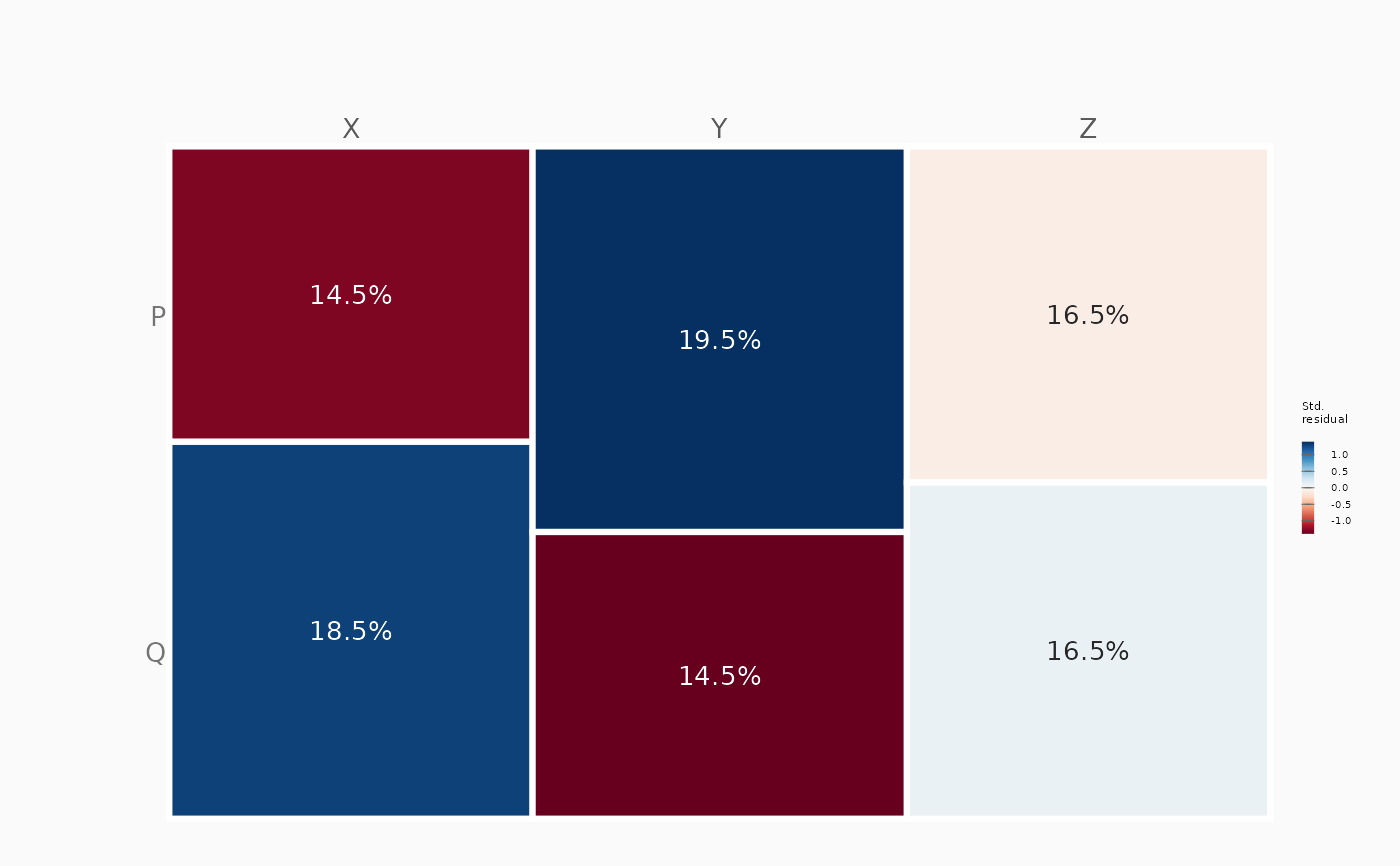
plot(res, tile_label = "percent", legend_size = 0.4)
# \donttest{
plot(res, tile_label = "percent", legend_size = 0.4)
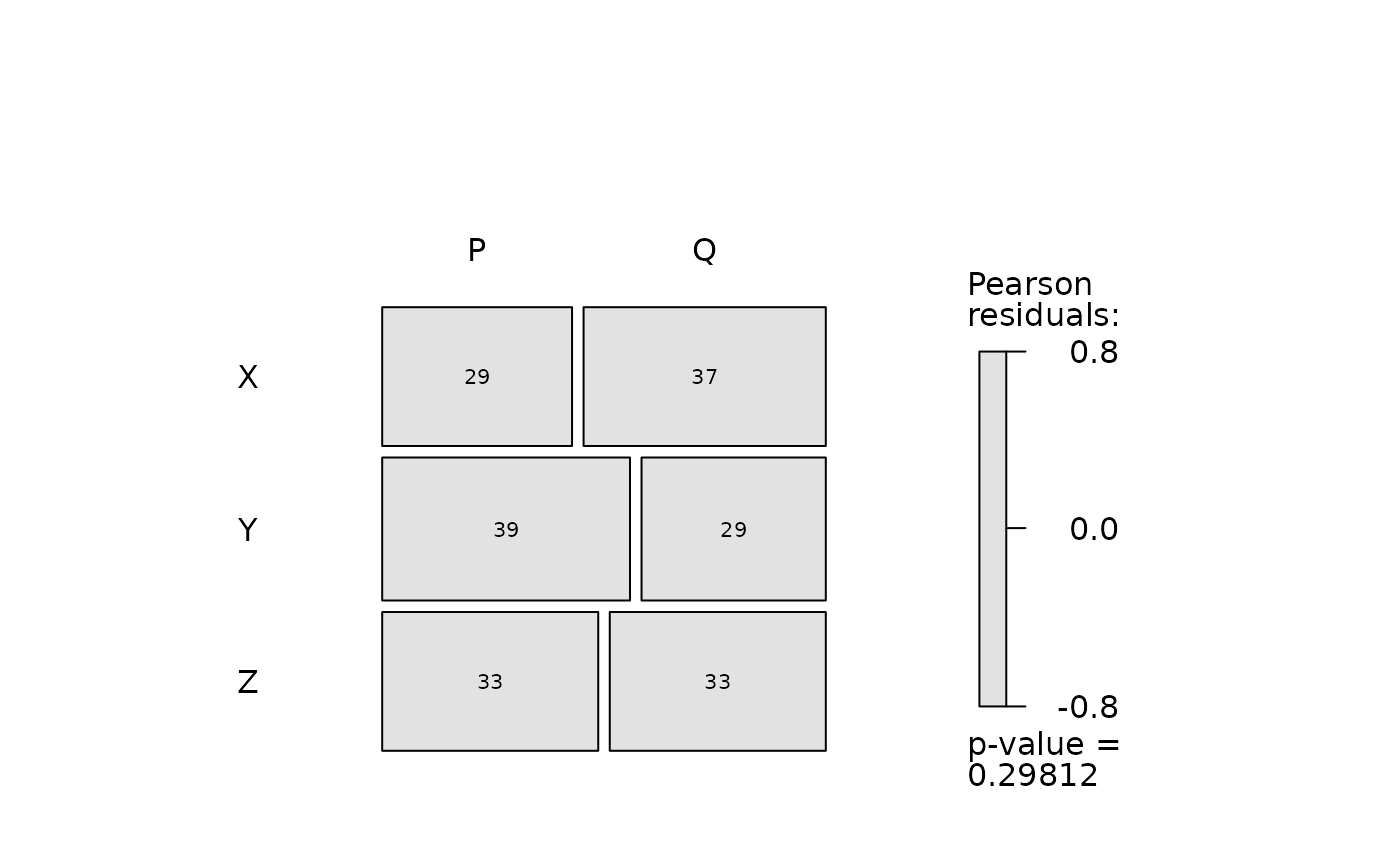
 plot(res, plot_style = "classic")
 # }
# }