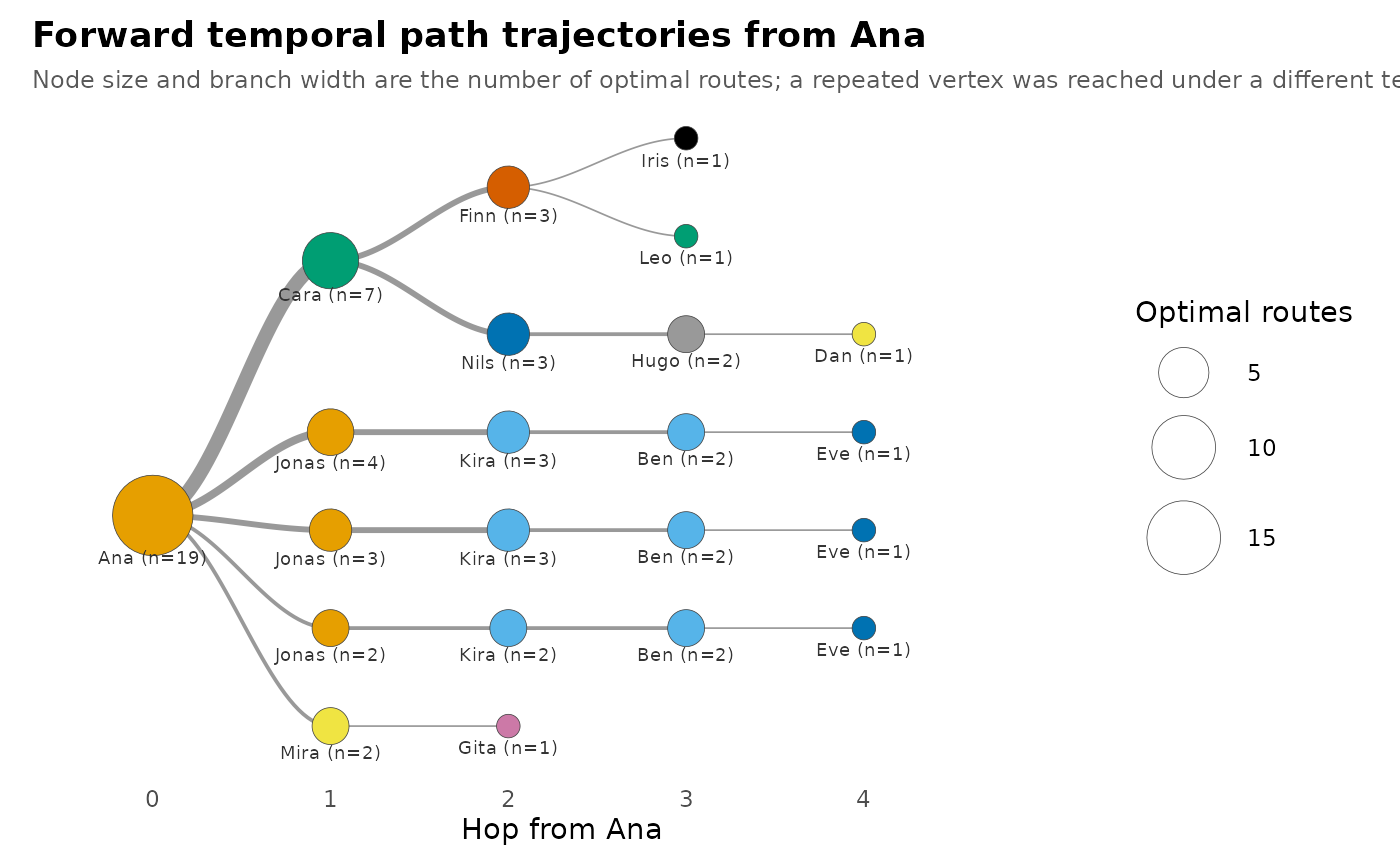
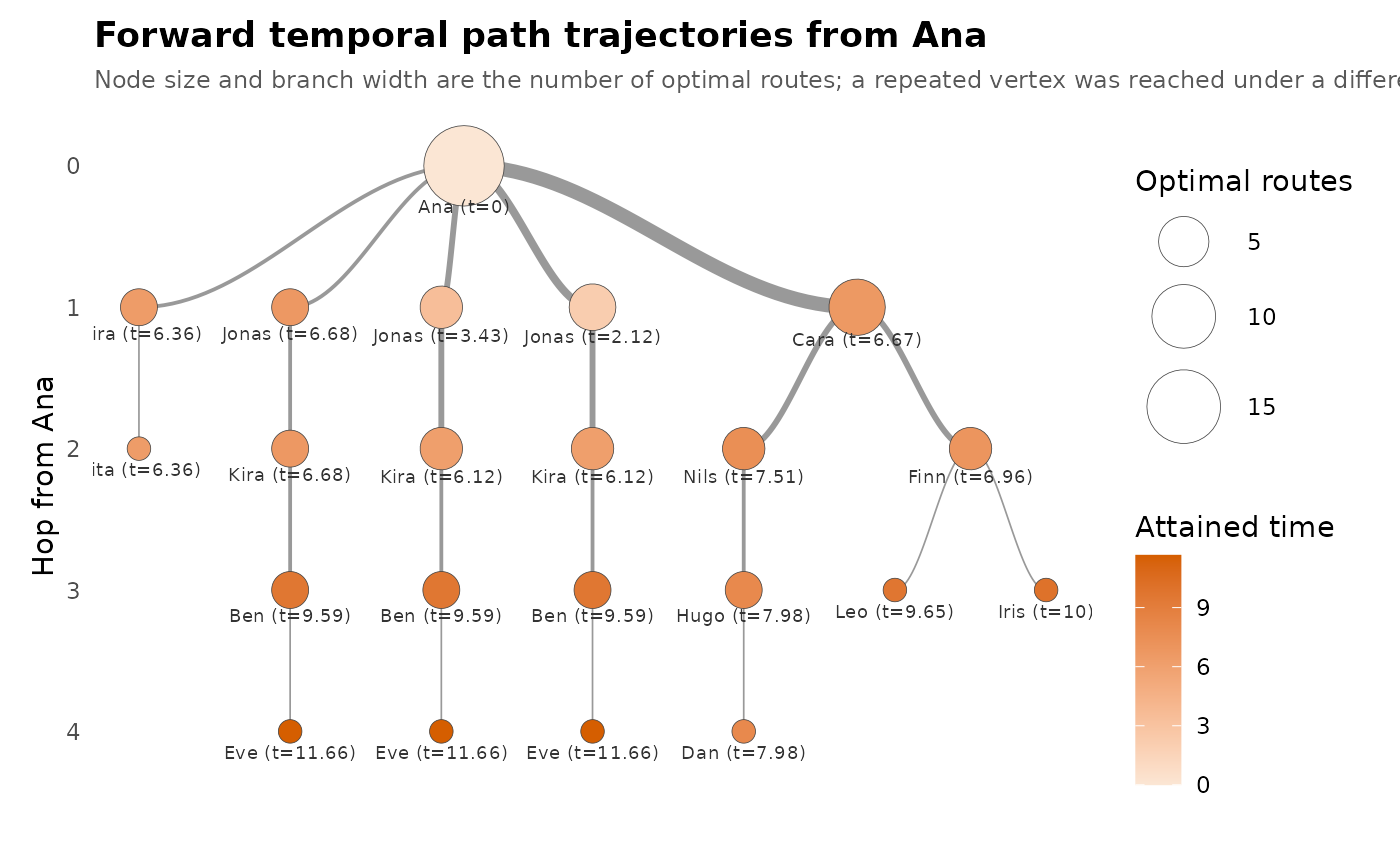
Draw optimal temporal paths as a trajectory tree
Source:R/path-trajectory.R
plot_path_trajectories.RdDraws the optimal route family returned by paths() using the
trajectory-tree grammar ported from the transitiontrees package: leaves
stacked in depth-first order, parents centred on their children, and
branches carried by a cosine smoothstep. Nodes follow that package's
horizontal phylogram rather than its capsule style – a count-sized filled
circle with its label set below it. Node size and branch width always show
how many optimal routes use a branch. Every node also prints the value of
the chosen measure beside its vertex name, so nothing is encoded by
colour alone: the default frequency view is free to fill each node with its
vertex's own colour, while the "time" and "predictability" views fill
from a ramp with a colour bar.
Forward paths grow away from the queried source. Backward paths are flipped so the queried target is the root and possible senders branch away from it. A named vertex repeats whenever it is reached under a different temporal history.
Arguments
- x
A result from
paths()or frompath_trajectories().- measure
What each node reports, and what fills it.
"frequency", the default, is the number of optimal routes through the branch and fills by vertex, since node size already carries the count;"time"is the attained time at the node and"predictability"the branching fraction of the parent's routes that continue along the branch, both filled from a ramp.- orientation
"horizontal"grows the tree left to right with hop number on the x axis;"vertical"grows it top to bottom.- min_count
Draw only branches used by at least this many optimal routes. Defaults to
1, the complete family. Ignored whenxis already apath_trajectories()result.- base_size
Base text size, as in
ggplot2::theme_minimal(). Defaults to eleven.- palette
Palette for the vertex colours of the frequency view, as in
plot.dynet(). Defaults to"okabe".
Value
A ggplot object. A tree with no branch to draw raises
dynet_empty_result; an x that is neither a paths() nor a
path_trajectories() result, or a base_size that is not one positive
number, raises dynet_bad_input.
See also
path_trajectories() for the tidy tree behind the plot.