Skip to contents

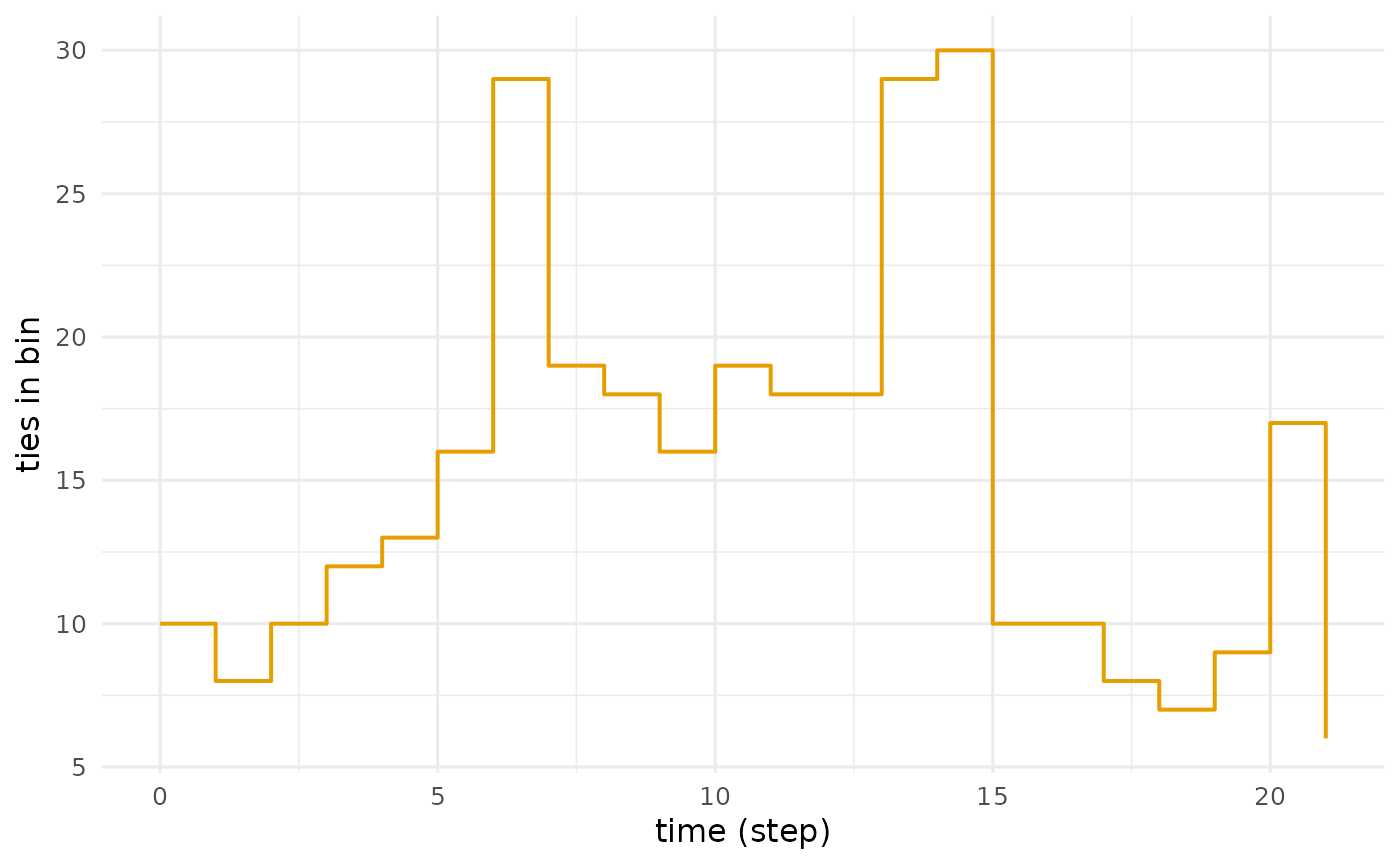
Plot how many ties each snapshot holds

Usage

# S3 method for class 'dynet_snapshot'
plot(x, base_size = 12, palette = "okabe", ...)

Arguments

x

A dynet_snapshot from snapshots().

base_size

Base font size.

palette

Palette specification, as in plot.dynet().

...

Ignored.

Value

A ggplot object, faceted by session when the result carries one. A result in which no tie is active raises an error of class dynet_empty_result rather than drawing an empty panel.

Examples

dn <- dynet(school_contacts)
bins <- snapshots(dn)
plot(bins)