Plot Reliability Analysis Results
Usage
# S3 method for class 'tna_reliability'
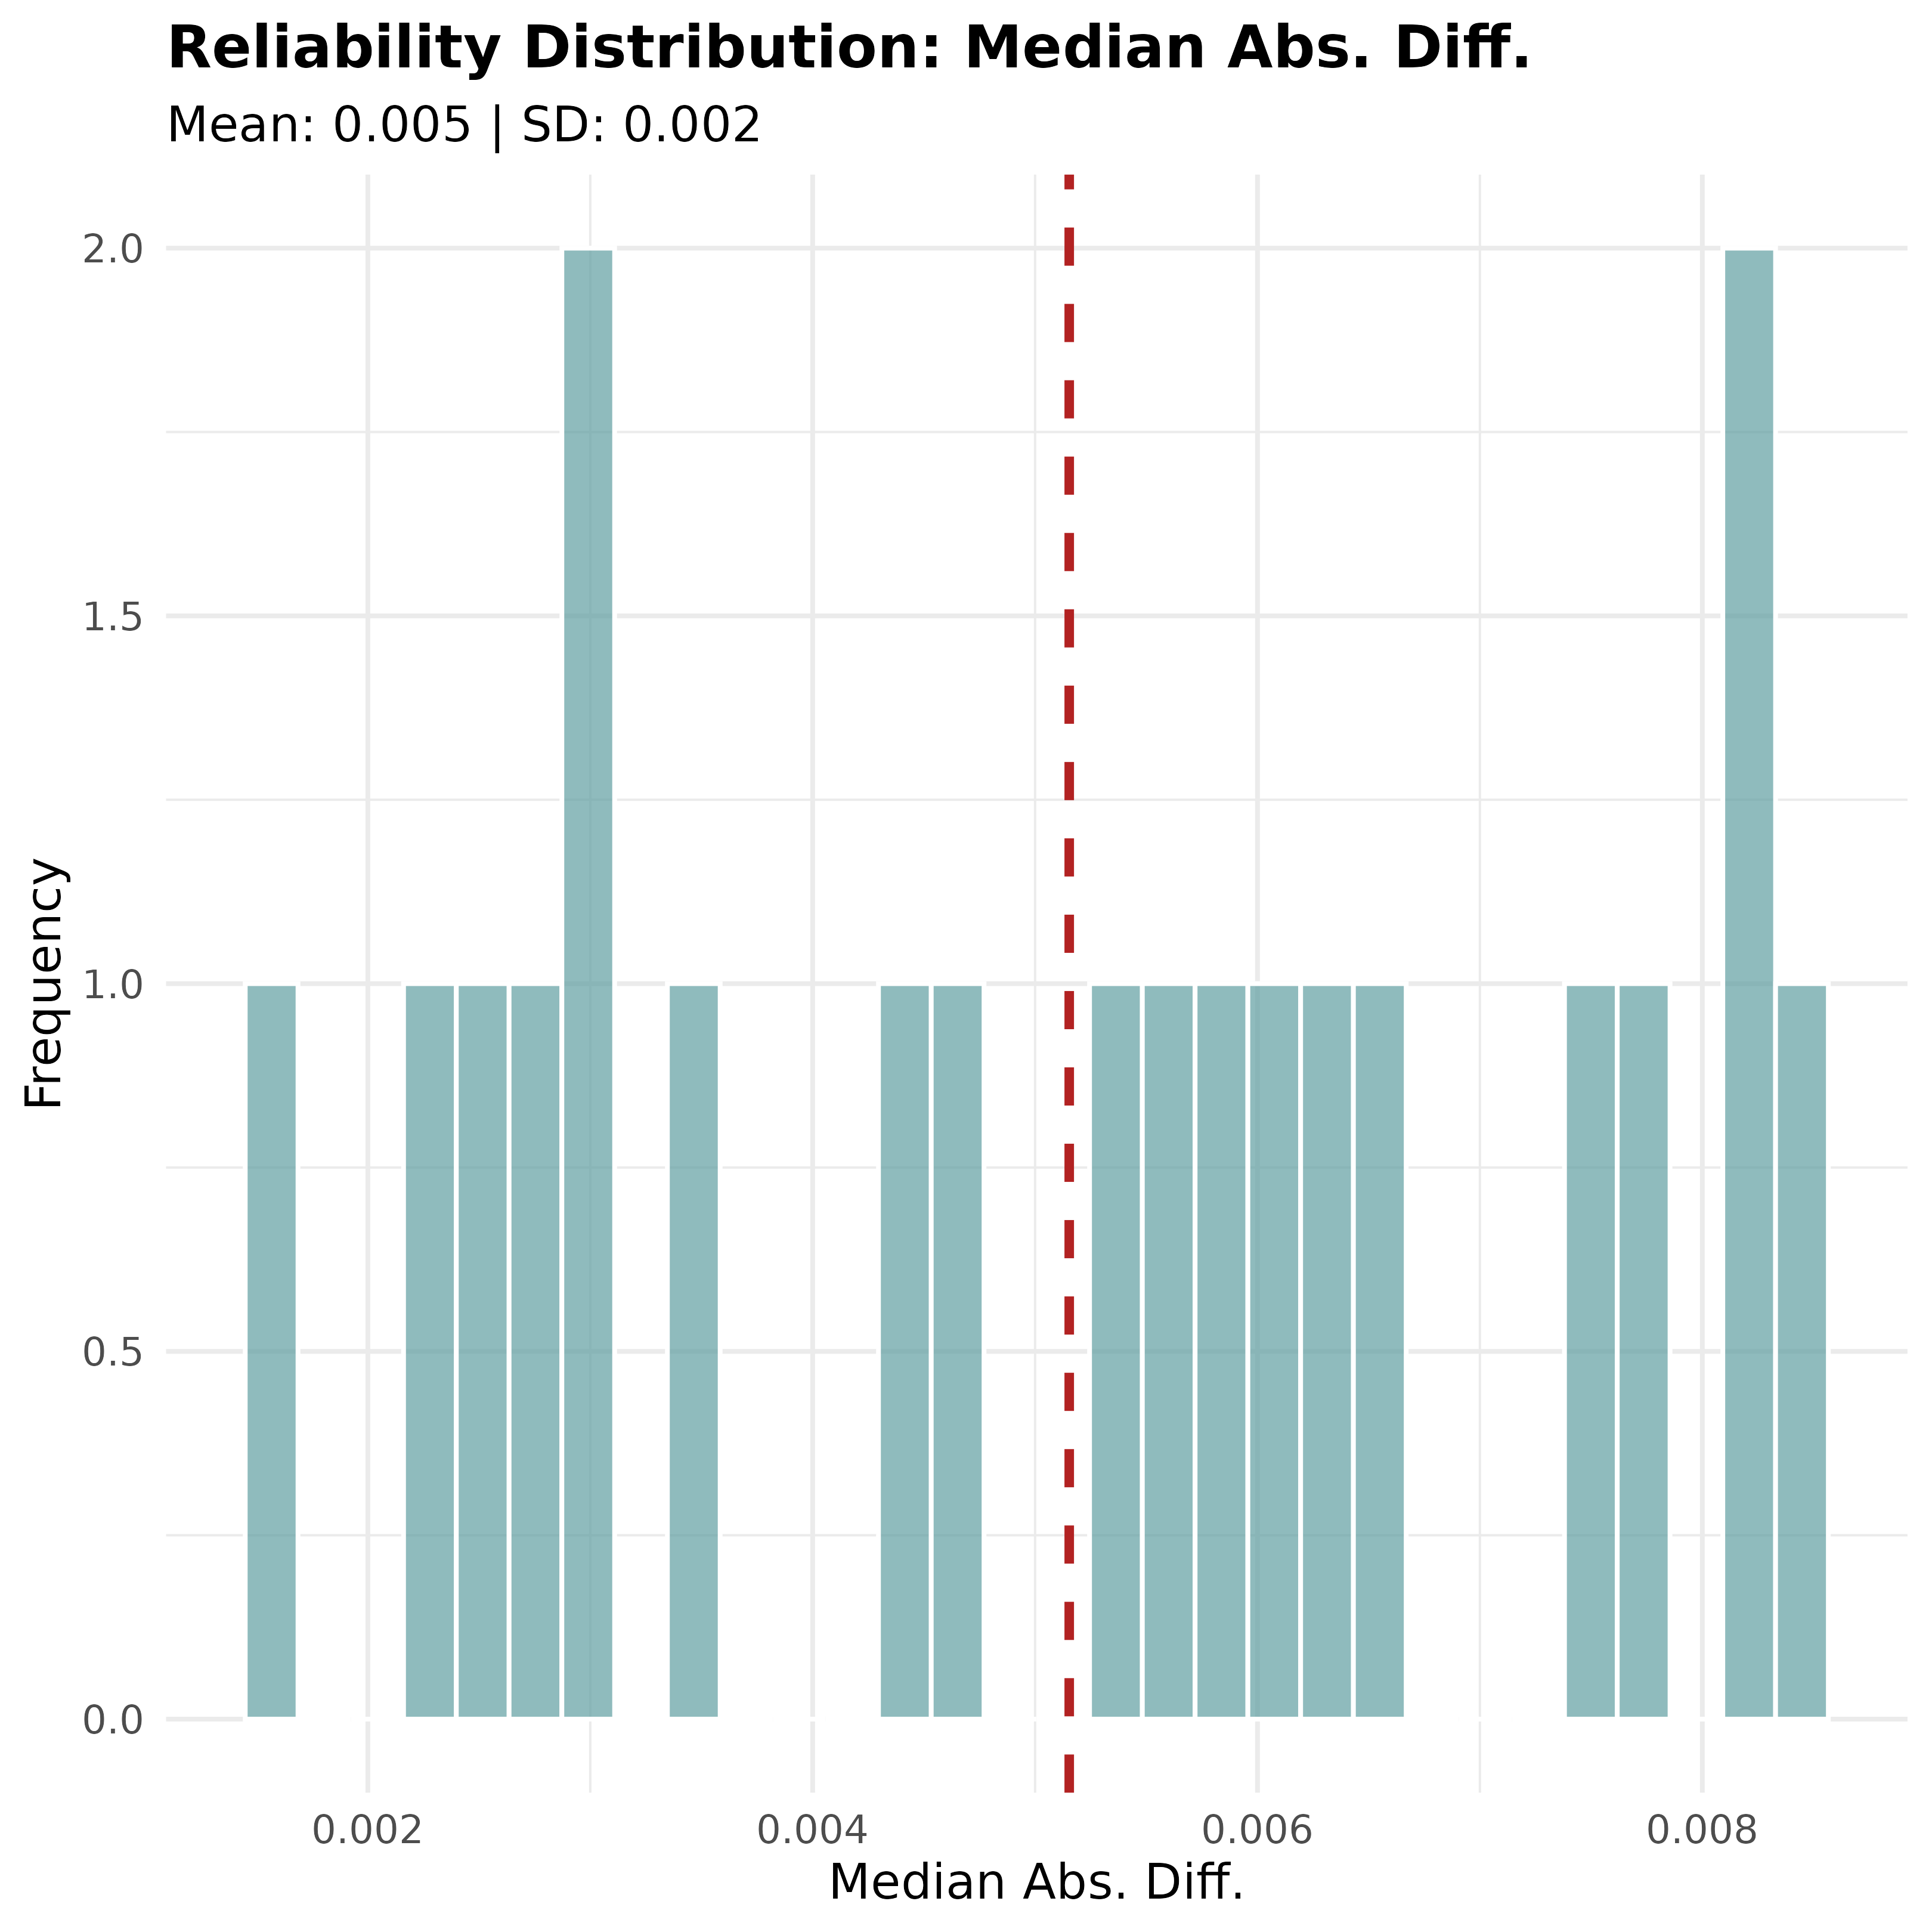
plot(x, type = "histogram", metric = "Median Abs. Diff.", bins = 30, ...)
Arguments
- x
A
tna_reliabilityobject.- type
A
characterstring specifying the plot type. The options are:"histogram"(default),"density", or"boxplot".- metric
A
characterstring specifying the metric to plot. The default is the median absolute difference ("Median Abs. Diff.").- bins
An
integerspecifying the number of bins to use for the histogram (type = "histogram"). The default is30. Ignored for the other plot types.- ...
Ignored
See also
Validation functions
bootstrap(),
deprune(),
estimate_cs(),
permutation_test(),
permutation_test.group_tna(),
plot.group_tna_bootstrap(),
plot.group_tna_permutation(),
plot.group_tna_stability(),
plot.tna_bootstrap(),
plot.tna_permutation(),
plot.tna_stability(),
print.group_tna_bootstrap(),
print.group_tna_permutation(),
print.group_tna_stability(),
print.summary.group_tna_bootstrap(),
print.summary.tna_bootstrap(),
print.tna_bootstrap(),
print.tna_clustering(),
print.tna_permutation(),
print.tna_reliability(),
print.tna_stability(),
prune(),
pruning_details(),
reliability(),
reprune(),
summary.group_tna_bootstrap(),
summary.tna_bootstrap()
Examples
# Small number of iterations for CRAN
model <- tna(engagement)
rel <- reliability(model, iter = 20)
plot(rel)