Draws one of five deterministic base-graphics views of a fitted topic model.
Usage
# S3 method for class 'sbert_topic_model'
plot(
  x,
  type = c("sizes", "terms", "representatives", "fit", "map"),
  by = "score",
  topics = NULL,
  per_topic = FALSE,
  n_terms = 8L,
  n_representatives = 5L,
  colors = topic_palette(nrow(x$topics)),
  max_points = 1500L,
  main = NULL,
  ...
)
Arguments
- x
An `sbert_topic_model` returned by [topics()].
- type
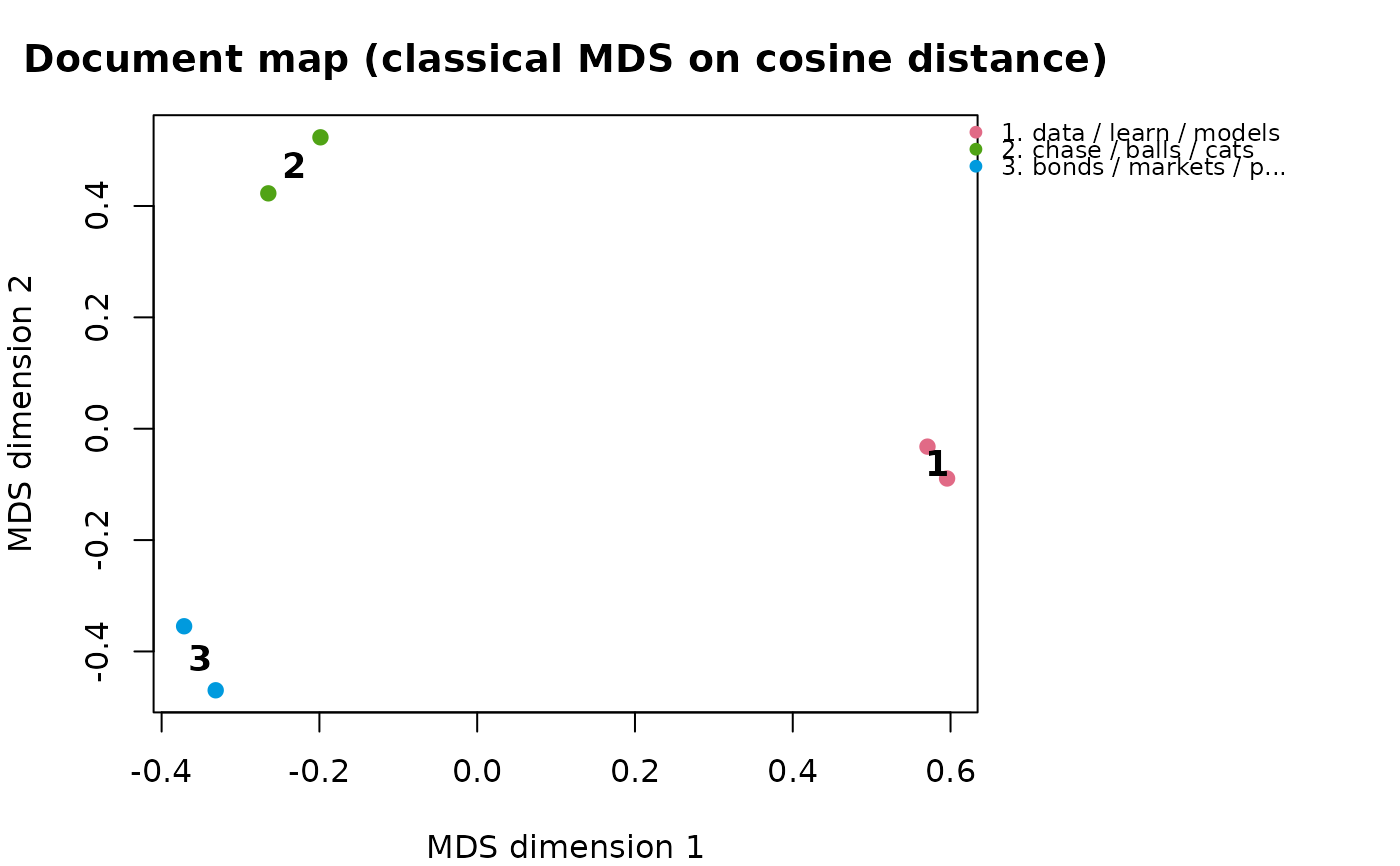
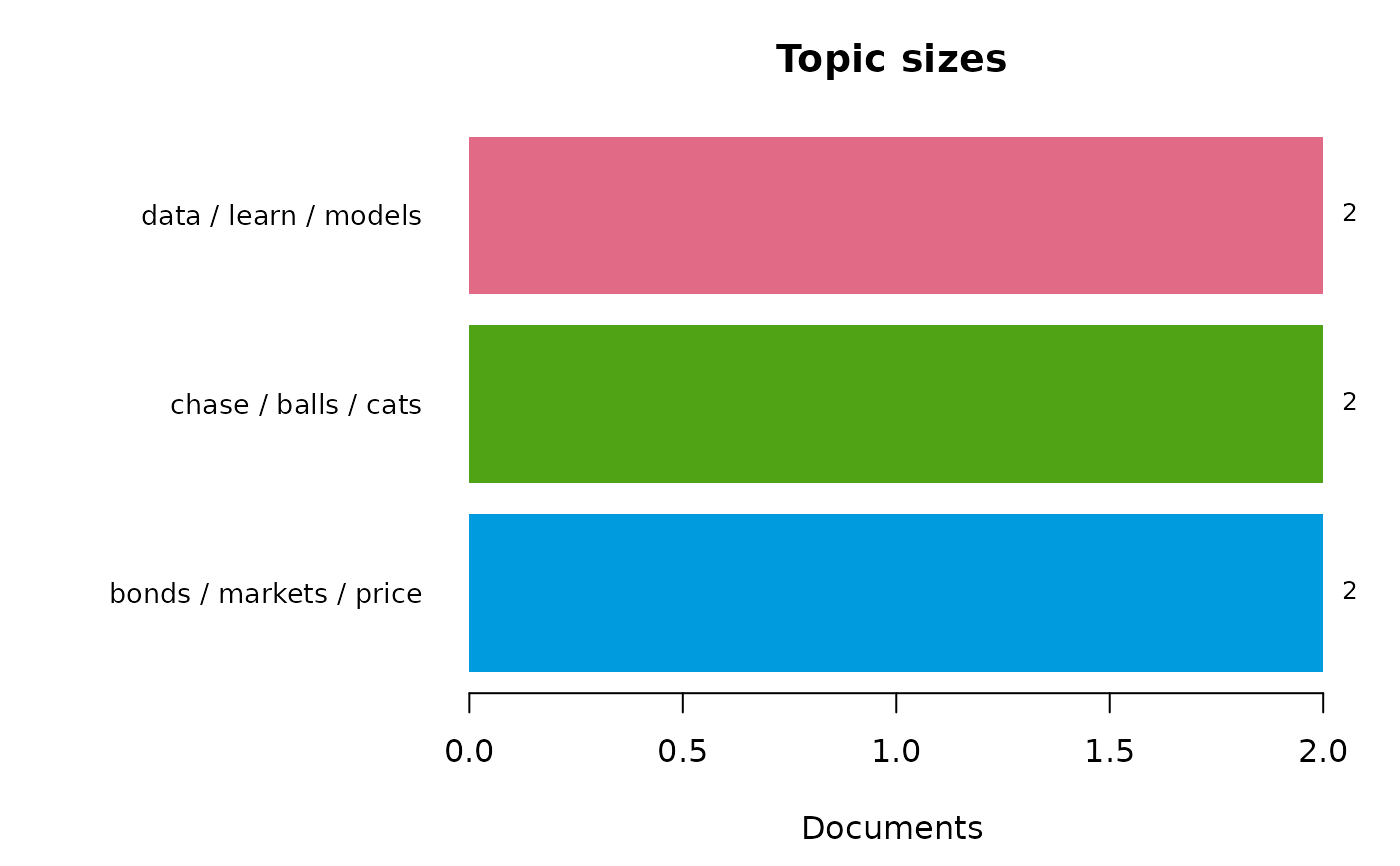
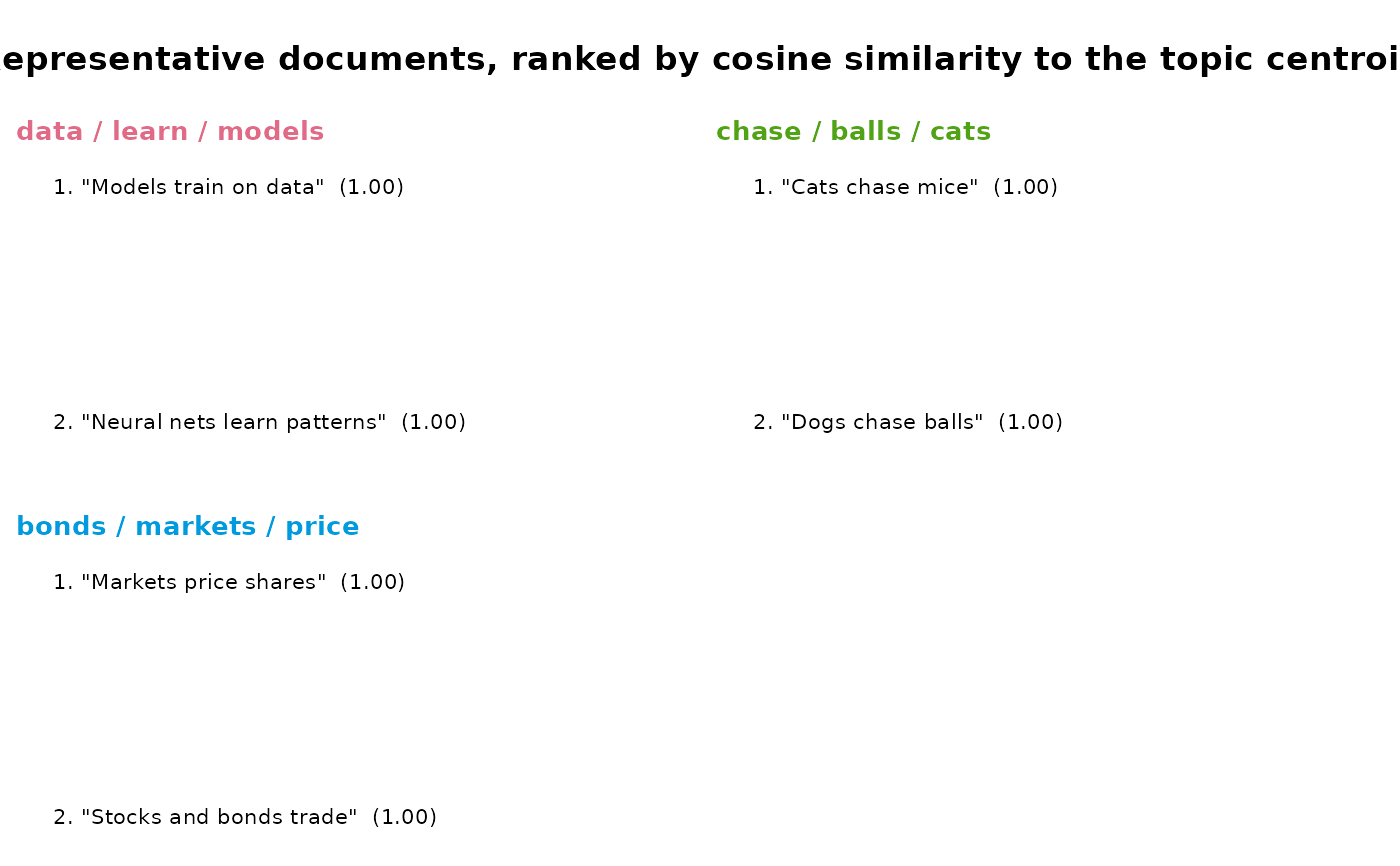
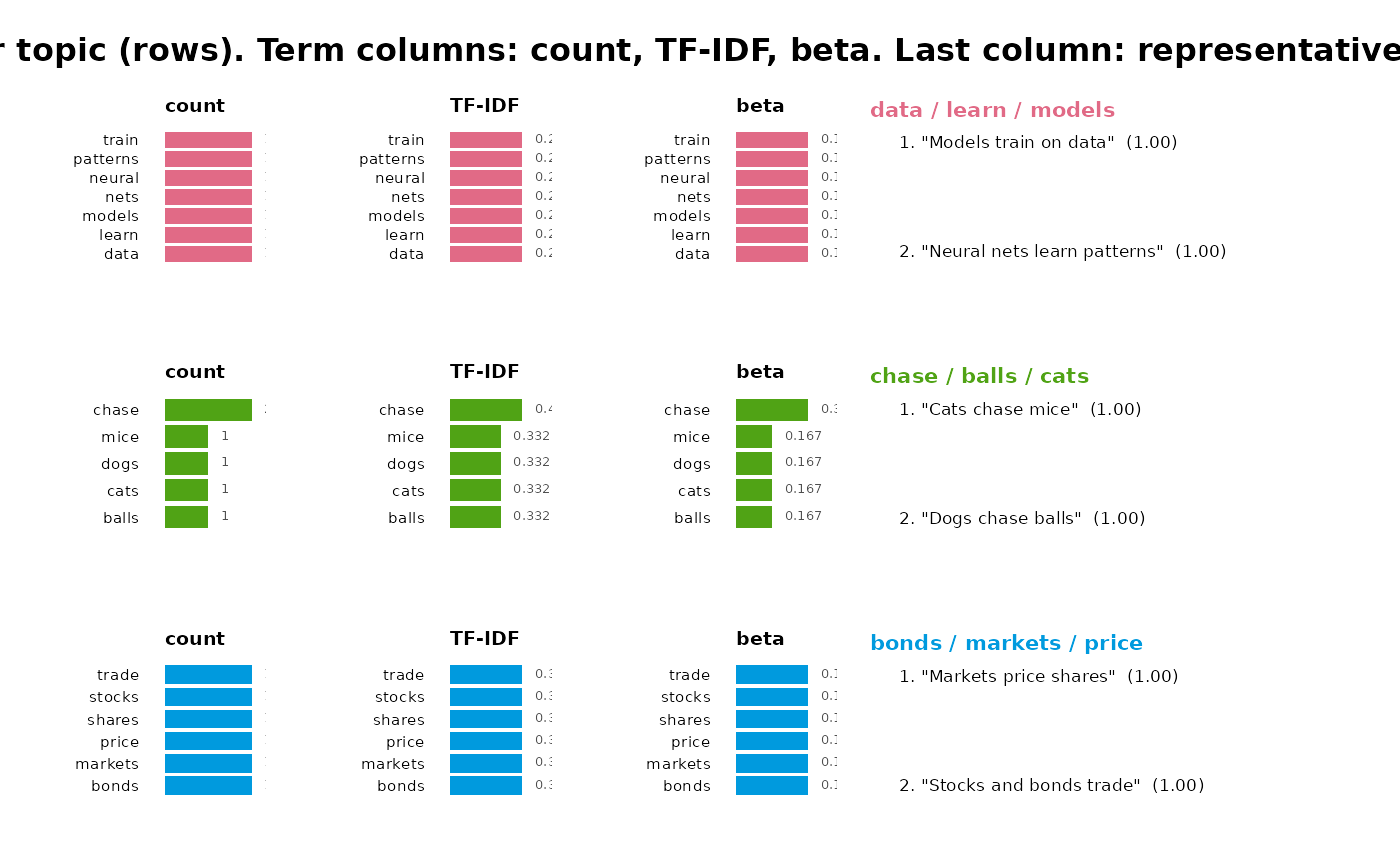
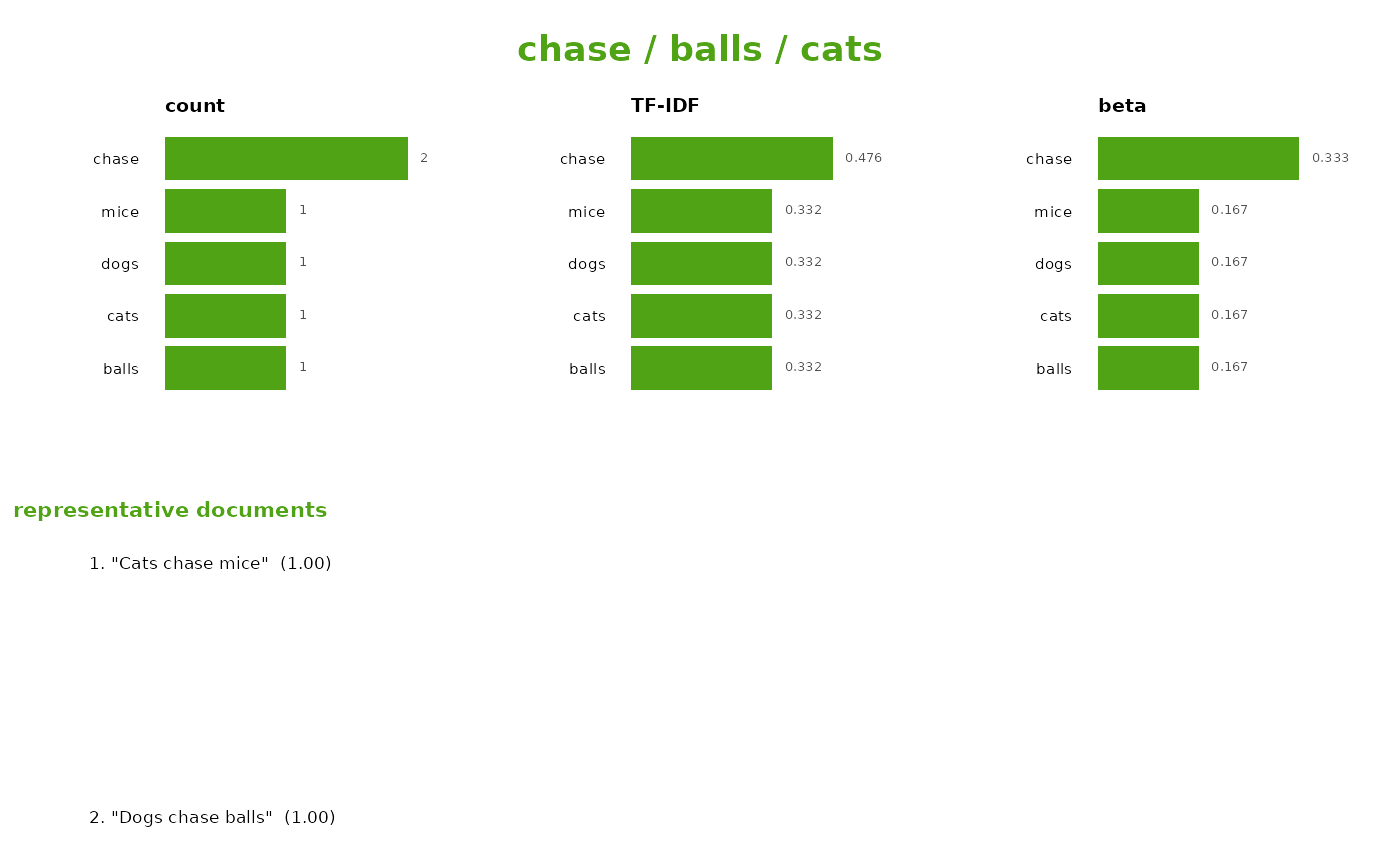
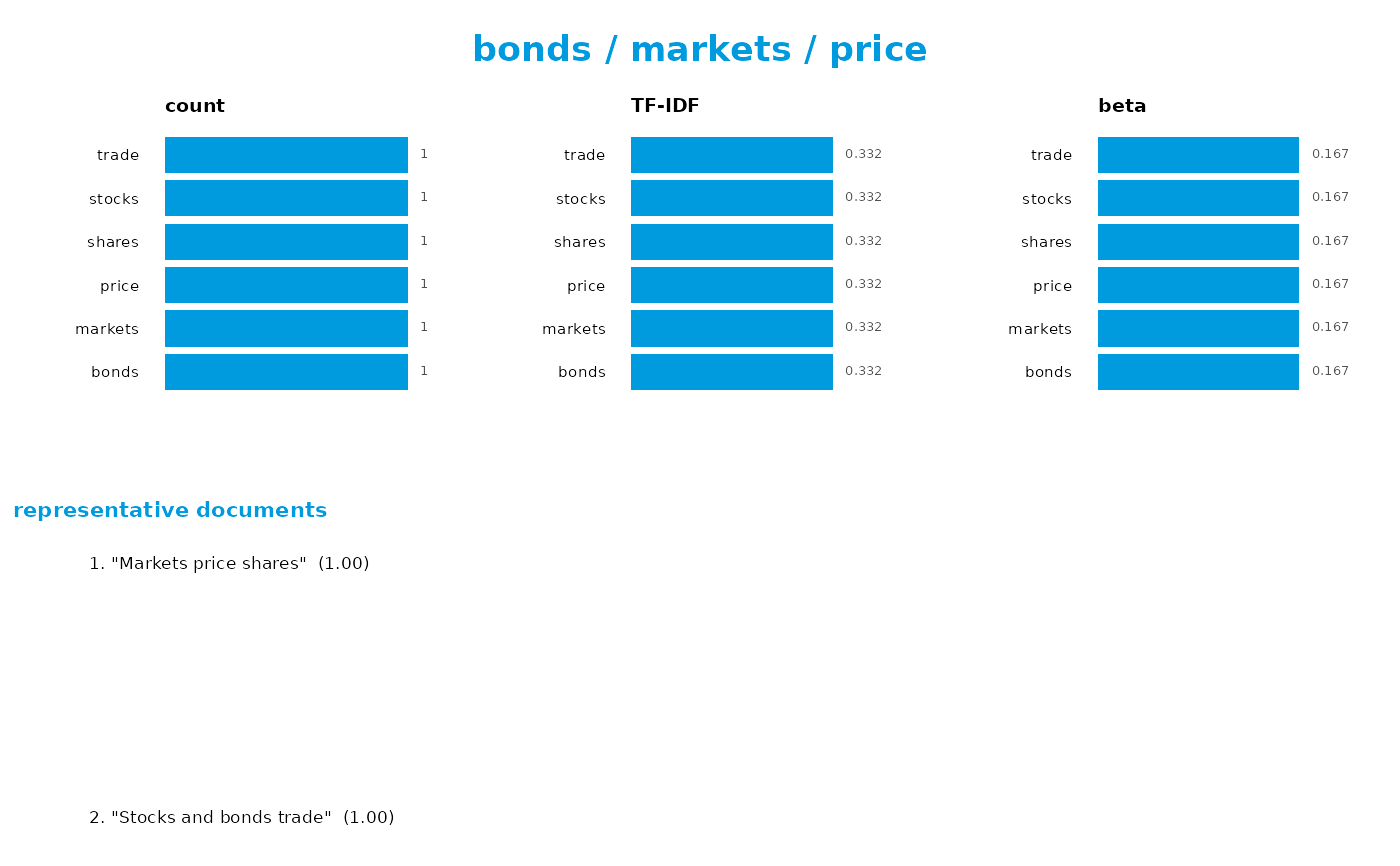
One of `"sizes"` (document count per topic), `"terms"` (top terms per topic), `"representatives"` (a ranked text list of the centroid-nearest documents per topic), `"fit"` (a per-topic report with all three term views – count, TF-IDF, beta – followed by the representative documents, one row per topic), or `"map"` (a two-dimensional classical-MDS projection of the document embeddings, colored by topic). The `"map"` view requires a model fitted with `keep_embeddings = TRUE`.
- by
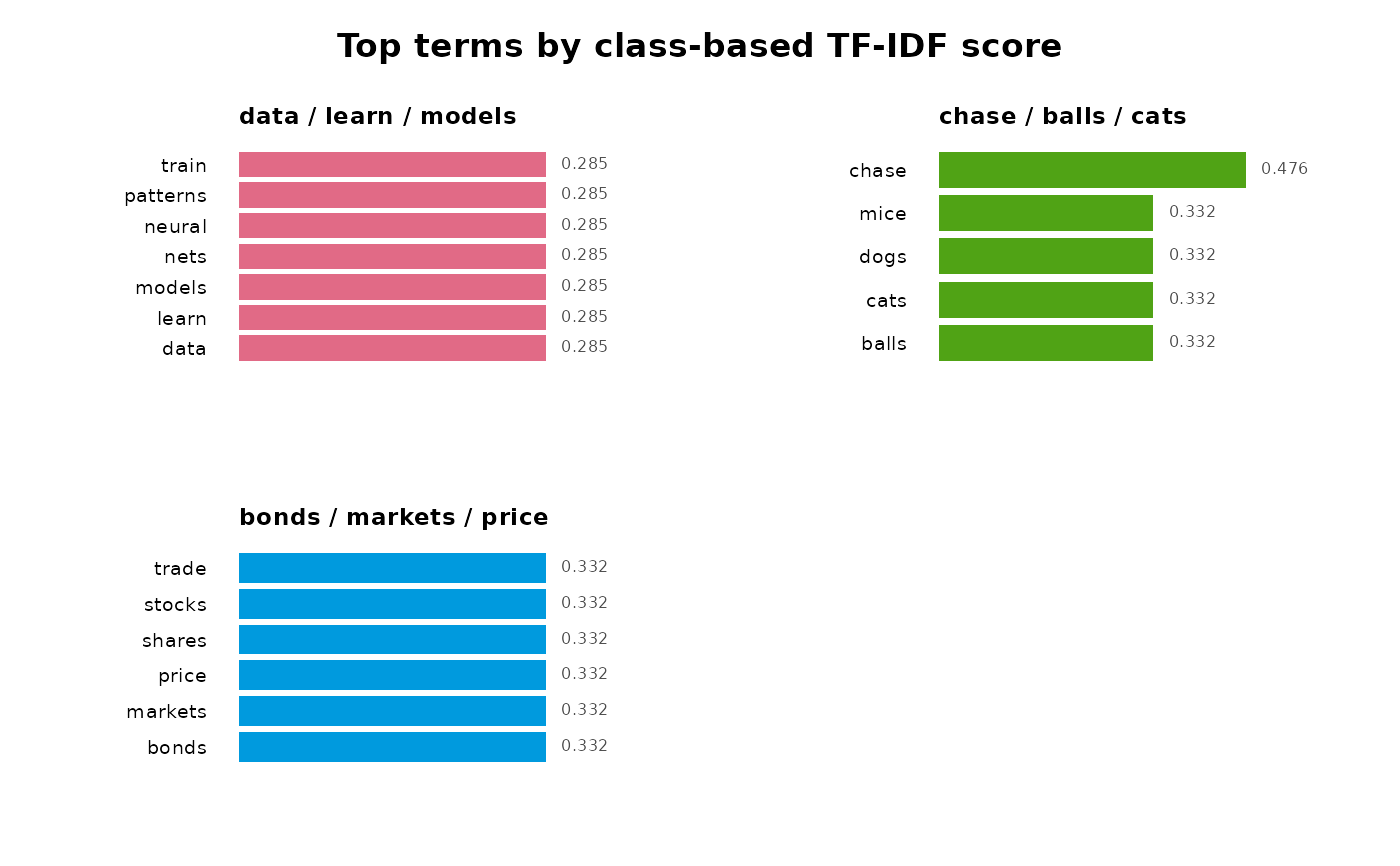
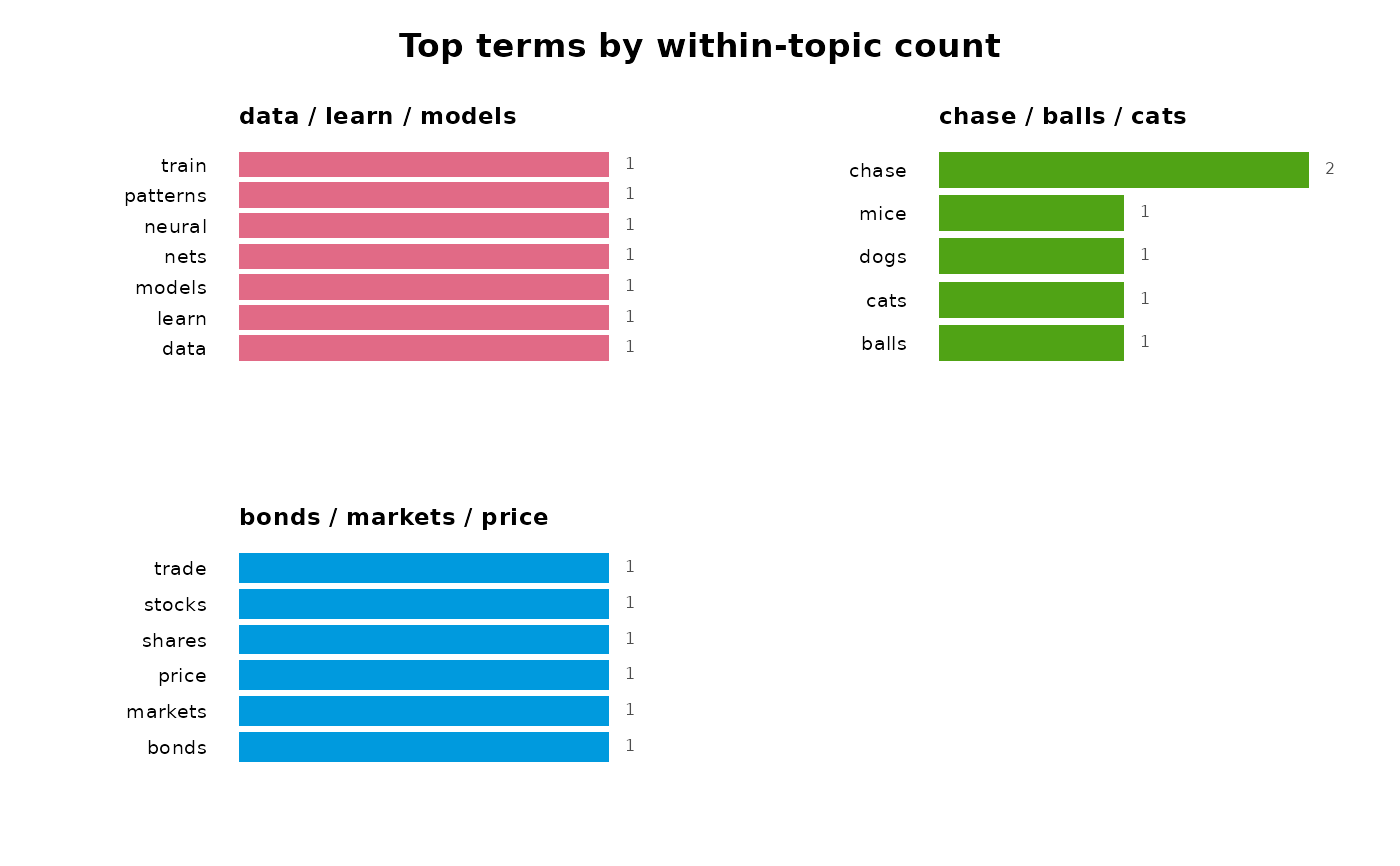
For `type = "terms"`, one or more of `"score"` (class-based TF-IDF, the default and most distinctive terms), `"beta"` (the generative within-topic word probability), and `"frequency"` (the raw within-topic count). A single value draws one panel per topic; several values draw one row per topic with a column for each metric.
- topics
For `type` `"terms"`, `"representatives"`, or `"fit"`, an optional vector of topic numbers to restrict the plot to. Defaults to all topics.
- per_topic
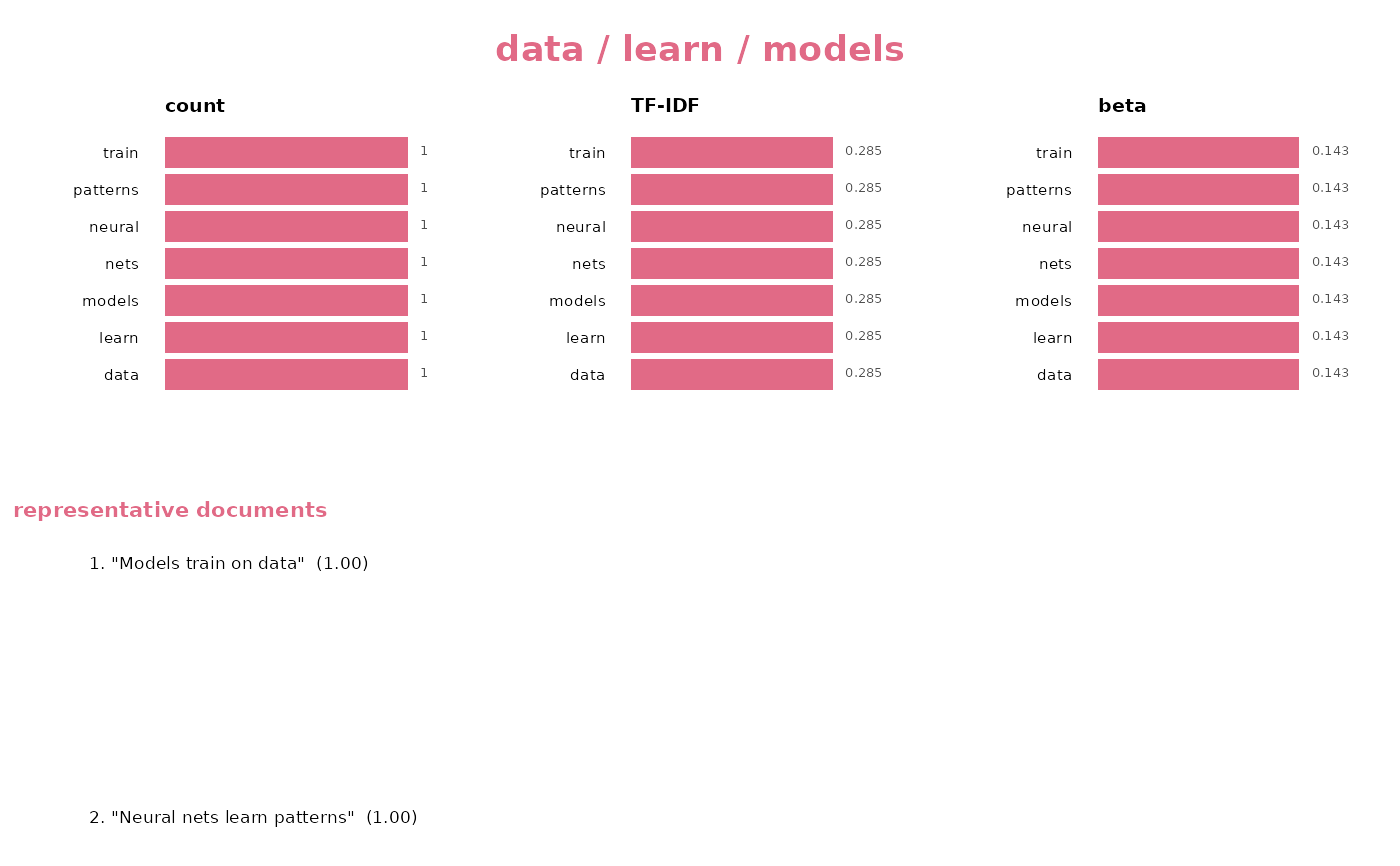
For `type` `"terms"`, `"representatives"`, or `"fit"`, draw a separate figure for each topic instead of arranging all topics into one gridded figure. Most useful with a device or `knitr` chunk that keeps every figure (each topic then becomes its own image).
- n_terms
Number of top terms shown per panel when `type` is `"terms"` or `"fit"`.
- n_representatives
Number of representative documents shown per panel when `type` is `"representatives"` or `"fit"`. When more are requested than the model stored at fit time, they are recomputed from the retained embeddings; if the model was fitted with `keep_embeddings = FALSE`, the stored set is used and a warning is issued.
- colors
Optional vector of topic colors; defaults to [topic_palette()].
- max_points
Maximum documents drawn when `type = "map"`. Larger corpora are thinned to a deterministic stratified subsample so the classical-MDS projection stays tractable.
- main
Optional figure title for `type = "fit"`. The default names the layout (term columns and representative documents).
- ...
Unused; present for S3 compatibility.
Examples
text <- c(
"Cats chase mice", "Dogs chase balls",
"Stocks and bonds trade", "Markets price shares",
"Neural nets learn patterns", "Models train on data"
)
embeddings <- rbind(
c(1, 0, 0), c(0.9, 0.1, 0),
c(0, 1, 0), c(0.1, 0.9, 0),
c(0, 0, 1), c(0.05, 0, 0.95)
)
topics <- topics(text, 3, embeddings = embeddings, keep_embeddings = TRUE)
plot(topics, type = "sizes")
 plot(topics, type = "terms")
 plot(topics, type = "terms", by = "frequency")
 plot(topics, type = "terms", by = c("frequency", "score", "beta"), topics = 1)
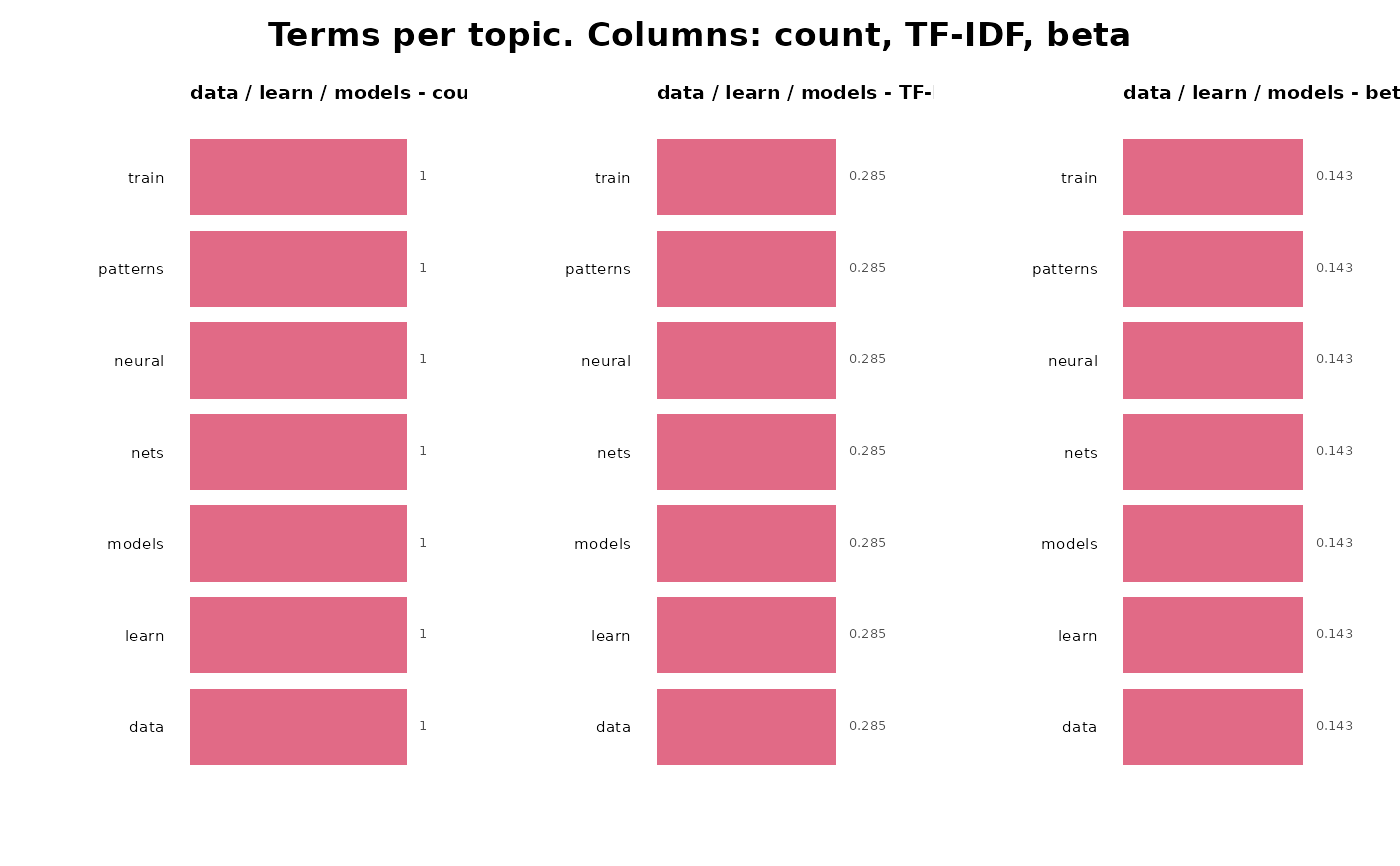 plot(topics, type = "representatives")
 plot(topics, type = "fit")
 plot(topics, type = "fit", per_topic = TRUE)
 plot(topics, type = "map")