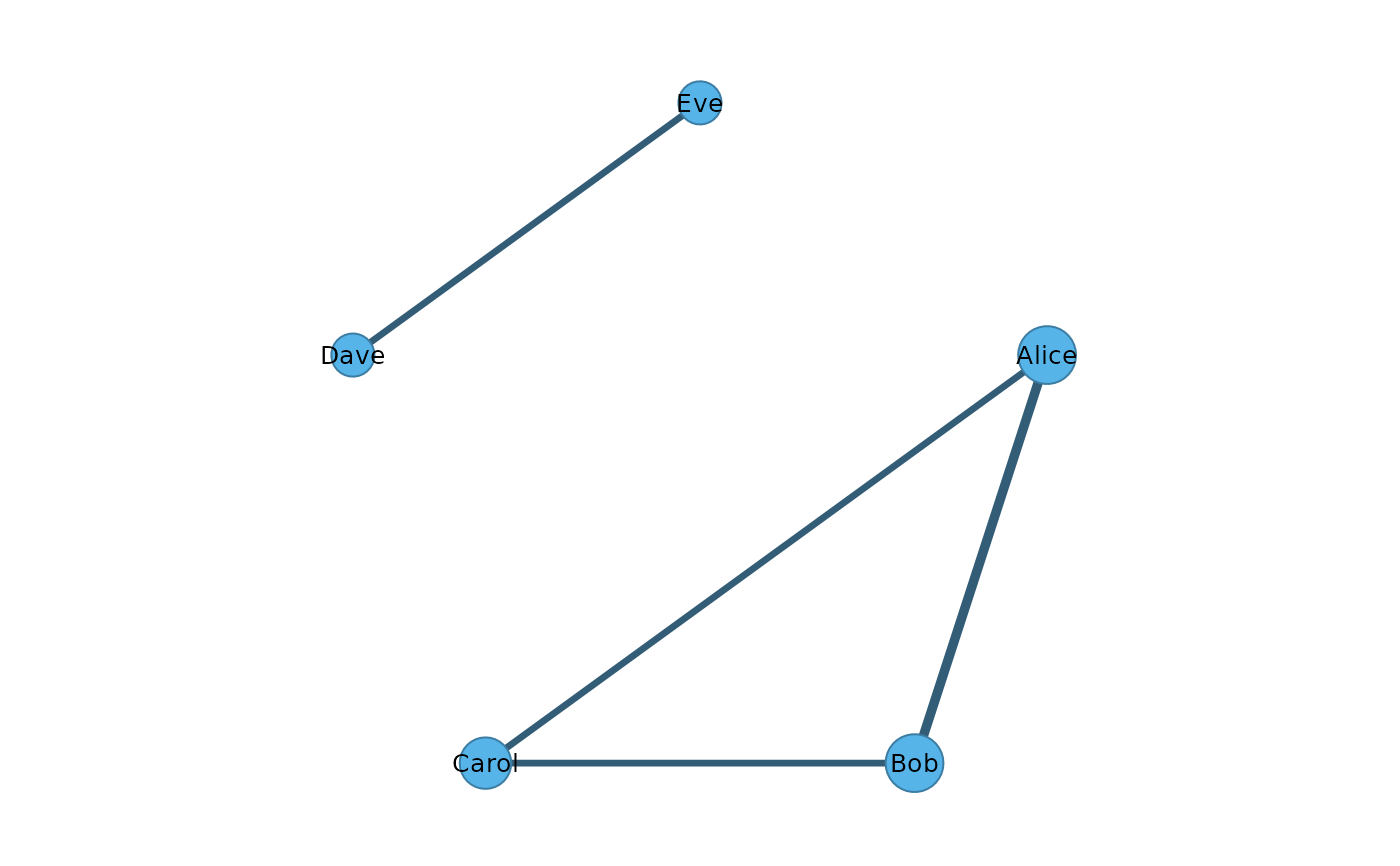
Plots the network returned by pairwise_network() with cograph::splot():
a circle layout, which keeps every label apart however strongly the
events are tied, edges whose width grows with the square root of their
weight, and nodes whose area grows with their strength, the sum of the
weights of their edges.
Usage
# S3 method for class 'net_hg_pairwise'
plot(x, ...)
Arguments
- x
A
net_hg_pairwisefrompairwise_network().- ...
Arguments passed to
cograph::splot()(e.g.layout,seed,minimum,node_fill); they override the defaults set here.
Examples
meetings <- data.frame(
  person = c("Alice", "Bob", "Carol", "Alice", "Bob", "Dave", "Eve"),
  meeting = c("m1", "m1", "m1", "m2", "m2", "m3", "m3"))
meeting_network <- pairwise_network(hypergraph(meetings, node = "person",
                                         hyperedge = "meeting"))
plot(meeting_network)