Constructs a net_hg the way a network is
defined from data. Membership data name a node and a hyperedge:
every node sharing one value of hyperedge (a session, a team, a
citation block) belongs to one hyperedge. An edge
list names from and to, and every row is a hyperedge of size two.
An optional weight column produces a weighted incidence matrix.
Usage
group_hypergraph(
  data,
  node = NULL,
  hyperedge = NULL,
  weight = NULL,
  nodes = NULL,
  sparse = FALSE,
  separator = NULL,
  from = NULL,
  to = NULL,
  member = NULL,
  cooccur_by = NULL,
  top = NULL,
  states = NULL,
  threshold = NULL,
  min_size = 1L,
  group = NULL,
  min_share = NULL
)
Arguments
- data
Data frame in long format, one row per node in a hyperedge or per edge; or a clustering of sequences – a mixture Markov fit (
net_mmm), a distance clustering (net_clustering), or the per-cluster networks built from either (netobject_group). See "Clustered sequences" below.- node
Character. Name of the column whose values become the hypergraph's nodes (people, events, words, items).
- hyperedge
Character. Name of the column whose shared values bind nodes into one hyperedge (sessions, trials, teams, citation blocks). When neither pair of columns is named,
fromandtoare detected case-insensitively from the alias tabletemporal_hypergraph()uses (source/target,sender/receiver, ...), and failing thatnodeandhyperedge.- weight
Character or
NULL. If supplied, the column is summed per(node, hyperedge)pair to produce a weighted incidence matrix. DefaultNULLproduces a 0/1 binary incidence matrix.- nodes
Optional vector giving the complete node universe. This keeps nodes with no observed group memberships as zero-incidence rows, which is needed for representations such as citation hypergraphs where every decision is a node but some decisions are never cited.
- sparse
Logical. Store incidence as a sparse
Matrix? Use this for large, sparse event data such as the full GFCC citation-block corpus.- separator
Split the
nodecolumn on this string, one row per member, before building. Bibliographic exports ship a hyperedge's members as a single delimited cell – EUR-Lexcitationcelexandeurovoc, Scopus and Web of Science reference and keyword fields – soseparator = ";"replaces the caller's own split, trim and drop-empties. Members empty after trimming are dropped, and a row left with no member contributes no hyperedge.- from, to
Column names of a pairwise edge list, as an alternative to
nodeandhyperedge.- member, cooccur_by
Deprecated names of
nodeandhyperedge; using them warns with ahypergraphs_deprecatedcondition.- top
The number of most frequent sets kept as hyperedges, in each value of
groupor over all hyperedges;Infkeeps every set. For a data frame, givingtop,groupormin_sharecounts sets (see "Frequent sets within groups"), and with none of them every value ofhyperedgebecomes one hyperedge. Clustered sequences and topic models keep8by default.- states
For counted sets: the states to keep, such as the events of interest. Every other state is removed from each sequence's set before counting, and a sequence left with no state is not counted.
NULL(default) keeps every state. For a topic model, the topics to keep.- threshold
Topic model only: the share at which a topic counts as present in a document, one number in (0, 1]. Required for a topic model and refused for any other input.
- min_size
For counted sets (
group,top,min_shareor a topic model): the smallest set counted (default1);2keeps only the sets of two or more. The share of a set is still taken over all sets of its group.- group
The comparison variable: count frequent sets separately within each value of this column, which must be constant within each
hyperedge(an outcome, a cluster, a year). Each value ofhyperedgeis then one set, thenodevalues it holds, and thetopmost frequent sets within each value ofgroupbecome hyperedges (see "Frequent sets within groups"). For a topic model, a column of the documents table of the fitted hypergraph.For counted sets: the minimum support, the smallest share of a group's sets that a set must reach to be kept, one number in (0, 1]. Giving it counts sets like
top; with notop, every set that reaches the share is kept (Agrawal & Srikant 1994).NULL(default) applies no minimum.
Value
A net_hg object with the same structure produced by
network_hypergraph() (hyperedges, incidence, nodes, n_nodes,
n_hyperedges, size_distribution, params), plus edge_data when
data carries hyperedge attributes (see Details). The params list
records source = "group_hypergraph" and the original column names.
For clustered sequences the object also has group_sizes and
state_counts (read them with hg_get()) and params records
source = "clustered_sequences", top, states and
unit = "sequences".
Details
The bipartite representation preserves the full group structure without projecting to a pairwise network. A group of three members A, B, C produces a single 3-hyperedge containing all three, not three pairwise edges AB, AC, BC. This avoids information loss when group interactions are the primary unit of analysis (Perc et al. 2013).
Unlike network_hypergraph() (which derives hyperedges from a network's
clique structure), group_hypergraph() takes group memberships
directly. The two functions are complementary:
group_hypergraph()- when group membership is observed (sessions, transactions, co-authorships).network_hypergraph()- when only pairwise interactions are observed and triadic structure must be inferred from triangles.
Rows with NA in the node, hyperedge or weight column are dropped
silently.
Note
Dense and sparse paths are tested for exact equality. The sparse path is additionally exercised by the full GFCC reproduction from the Legal Hypergraphs Zenodo archive (3,618 nodes, 46,165 hyperedges and 77,187 nonzero incidences).
A dense incidence with more than .Machine$integer.max cells cannot be
addressed by the flat cell index, and would exhaust memory well before
that. It raises the classed error hypergraphs_dense_too_large rather than
attempting the allocation; pass sparse = TRUE for data at that scale.
Frequent sets within groups
With group, top or min_share, a data frame is read as transactions.
Each value of hyperedge (a trial, a session, a basket) is one set, the
distinct node values it holds, and the sets are counted within each value
of group, which must be constant within a hyperedge. The top most
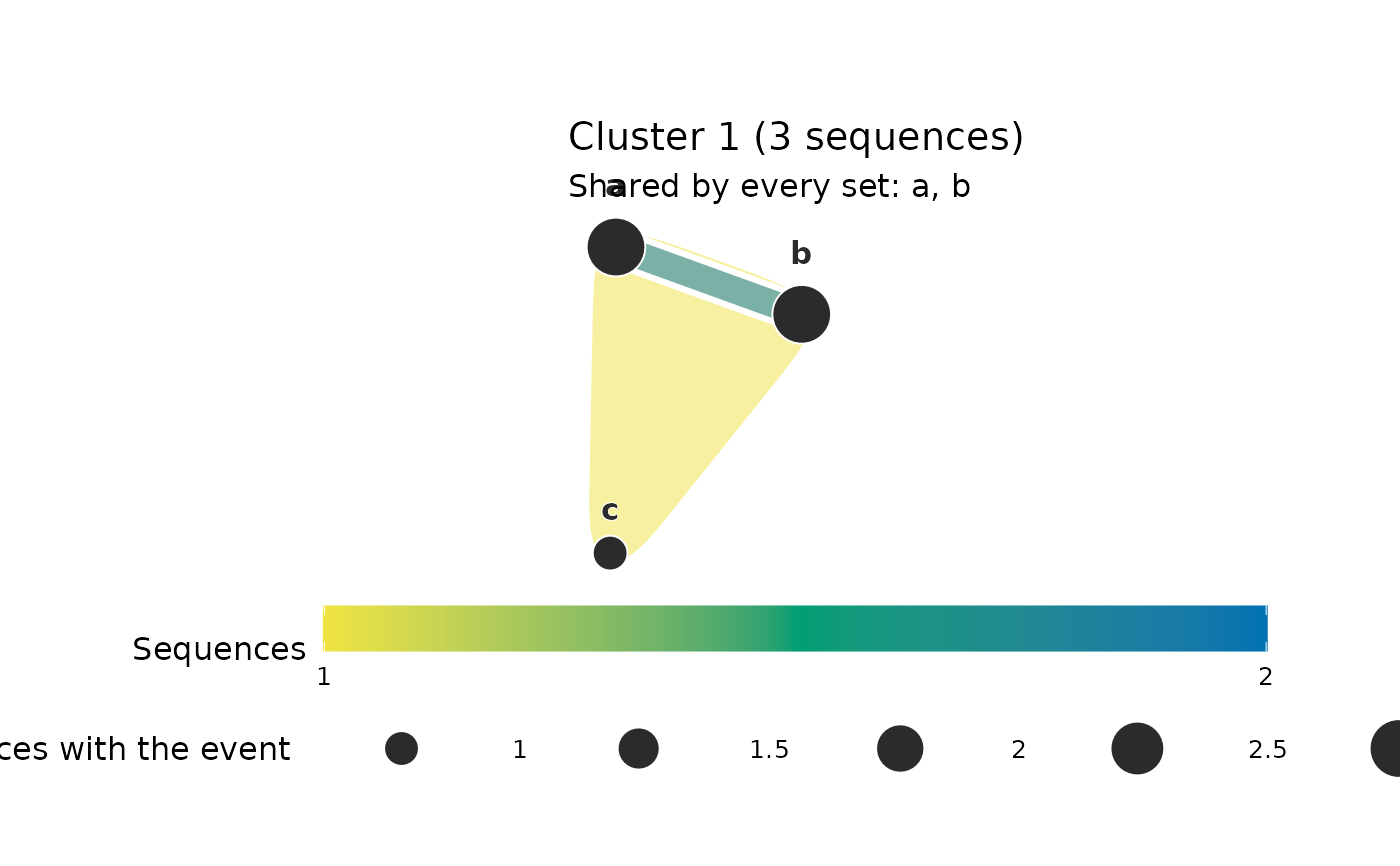
frequent sets of each value of group become hyperedges, counted exactly as for clustered sequences below,
and hg_get(hg, what = "sets") reads them with their count and share
of the value's sets. Without group, the sets are counted over all
hyperedges together, under one value named after hyperedge
("All sessions").
plot(hg, group = ) draws the sets of one value, every node sized by the
sets that contain it. states keeps only
the listed node values, and min_size the sets of at least that many.
Topic combinations
Given a mixed-membership topic model fitted by hg_topics(), every
document is reduced to the set of topics whose share in it is at least
threshold, the thresholded topic presence used to build topic
co-occurrence networks (Abuhay et al. 2017; Cassi et al. 2017). A
document on love, hate and romance gives the set of those three topics.
The top most frequent sets become hyperedges, counted exactly as for
clustered sequences below, with each document as one transaction, and the
topics are the nodes. top = Inf keeps every set, and min_size = 2
keeps only the sets that combine two or more topics. group names a column of the documents table of
the fitted hypergraph, such as a publication year or an author, and the
sets are then counted within each of its values; NULL (default) counts
them over all documents. A document with no topic at the threshold is not
counted. Read the sets with hg_get(hg, what = "sets"); count is the
number of documents with exactly that set and share its proportion of
the group's documents.
Clustered sequences
Given a clustering of sequences, every sequence of every group is reduced to
the set of its distinct states (order and repetition dropped; NA and
empty cells ignored), and the top most frequent sets of each group
become hyperedges – frequent-itemset support counting with each sequence
as one transaction (Agrawal & Srikant 1994), restricted to the sets that
occur exactly. Sets of equal count are ranked by their name (states
sorted and joined by " + "). Groups are named "Cluster 1",
"Cluster 2", ... for a net_mmm or net_clustering, and by the list
names of a netobject_group, so renamed groups carry through.
Integer-coded states are decoded to their labels. The objects are read
by their structure; the package that fitted them is not needed.
The hyperedges are named "<group>: <set>" and carry group, set and
count (sequences with exactly that set) as hyperedge attributes, so
plot() colours and titles them by count in "sequences", and
plot(hg, group = "Cluster 1") draws one group's sets with each node
sized by the sequences of that group containing the state. Read the
tables with hg_get(hg, what = "sets") (one row per hyperedge:
its group, set, size, count and share of the group's sequences) and
hg_get(hg, what = "state_counts") (one row per group and
state). A malformed clustering (no $data, assignments that do not match
it, unnamed networks) raises hypergraphs_bad_input.
Every other column of data that is constant within a hyperedge (a
session's date, a team's department) is kept as a hyperedge attribute in
the result's edge_data table, one row per hyperedge, where
hg_subset()'s where argument and pairwise_network()'s edge_source can
use it. Columns that vary within a hyperedge describe memberships, not
hyperedges, and are left out.
References
Agrawal, R., & Srikant, R. (1994). Fast algorithms for mining association rules in large databases. In Proceedings of the 20th International Conference on Very Large Data Bases (VLDB) (pp. 487-499). Morgan Kaufmann.
Abuhay, T. M., Kovalchuk, S. V., Bochenina, K., Kampis, G., Krzhizhanovskaya, V. V., & Lees, M. H. (2017). Analysis of computational science papers from ICCS 2001-2016 using topic modeling and graph theory. Procedia Computer Science, 108, 7-17. doi:10.1016/j.procs.2017.05.183
Cassi, L., Lahatte, A., Rafols, I., Sautier, P., & de Turckheim, E. (2017). Improving fitness: Mapping research priorities against societal needs on obesity. Journal of Informetrics, 11(4), 1095-1113. doi:10.1016/j.joi.2017.09.010
Perc, M., Gomez-Gardenes, J., Szolnoki, A., Floria, L. M., & Moreno, Y. (2013). Evolutionary dynamics of group interactions on structured populations: a review. Journal of the Royal Society Interface 10(80), 20120997. doi:10.1098/rsif.2012.0997
See also
network_hypergraph() for the clique-based constructor,
temporal_hypergraph() for the same inputs with a clock.
Examples
df <- data.frame(
  person = c("Alice", "Bob", "Carol", "Alice", "Bob",
             "Dave", "Carol", "Dave", "Eve"),
  session = c("S1", "S1", "S1", "S2", "S2",
              "S3", "S3", "S3", "S3")
)
hg <- group_hypergraph(df, node = "person", hyperedge = "session")
print(hg)
#> Hypergraph: 5 nodes, 3 hyperedges (sizes 2: 1, 3: 2)
#> Source: group membership (node = person, hyperedge = session)
#>  hyperedge size           members
#>         S1    3 Alice, Bob, Carol
#>         S2    2        Alice, Bob
#>         S3    3  Carol, Dave, Eve
summary(hg)
#> Hypergraph summary
#>   Nodes:         5
#>   Hyperedges:    3
#>   Mean size:     2.67
#>   Max size:      3

contacts <- data.frame(from = c("a", "b"), to = c("b", "c"))
group_hypergraph(contacts, from = "from", to = "to")
#> Hypergraph: 3 nodes, 2 hyperedges (sizes 2: 2)
#> Source: group membership (node = actor, hyperedge = edge)
#>  hyperedge size members
#>         e1    2    a, b
#>         e2    2    b, c

# a clustering of sequences, shaped as a mixture Markov fit (net_mmm)
fit <- structure(list(
  data = data.frame(V1 = c("a", "a", "b", "a", "c"),
                    V2 = c("b", "b", "c", "c", "a"),
                    V3 = c("a", NA, "a", "b", "b")),
  assignments = c(1L, 1L, 2L, 1L, 2L), k = 2L
), class = "net_mmm")
sets <- group_hypergraph(fit, top = 3)
hg_get(sets, what = "sets")
#>       group            hyperedge       set size count     share
#> 1 Cluster 1     Cluster 1: a + b     a + b    2     2 0.6666667
#> 2 Cluster 1 Cluster 1: a + b + c a + b + c    3     1 0.3333333
#> 3 Cluster 2 Cluster 2: a + b + c a + b + c    3     2 1.0000000
plot(sets, group = "Cluster 1")