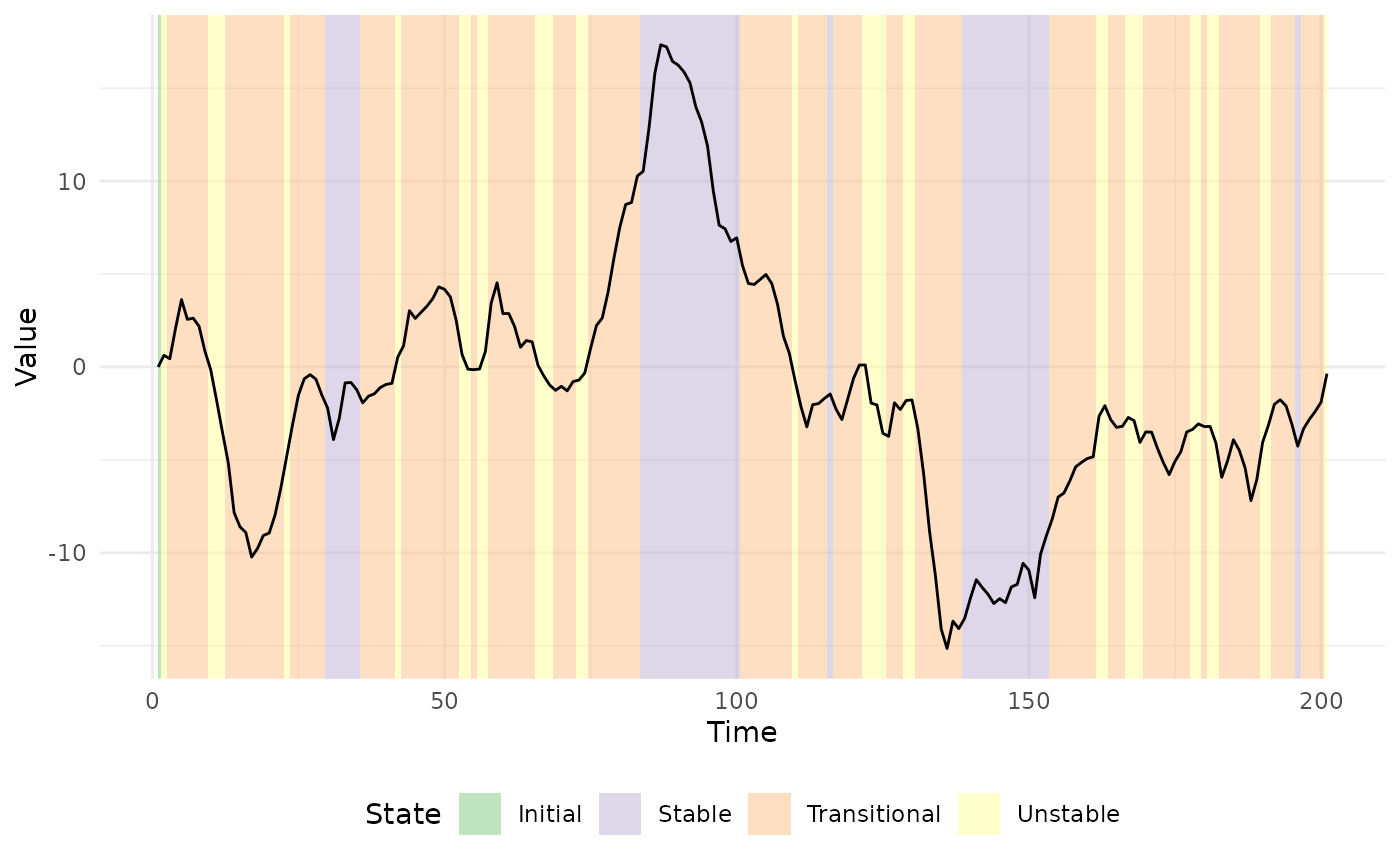
Plot Time Series Data with Detected Regime Stability
Usage
# S3 method for class 'regimes'
plot(x, points = FALSE, ...)
Arguments
- x
[
regimes]
Output ofdetect_regimes().- points
[
logical(1)]
Should a point be added for each observation? The points are colored by regime stability (default:FALSE).- ...
Ignored.