R/plot.R
plot.ews.Rd
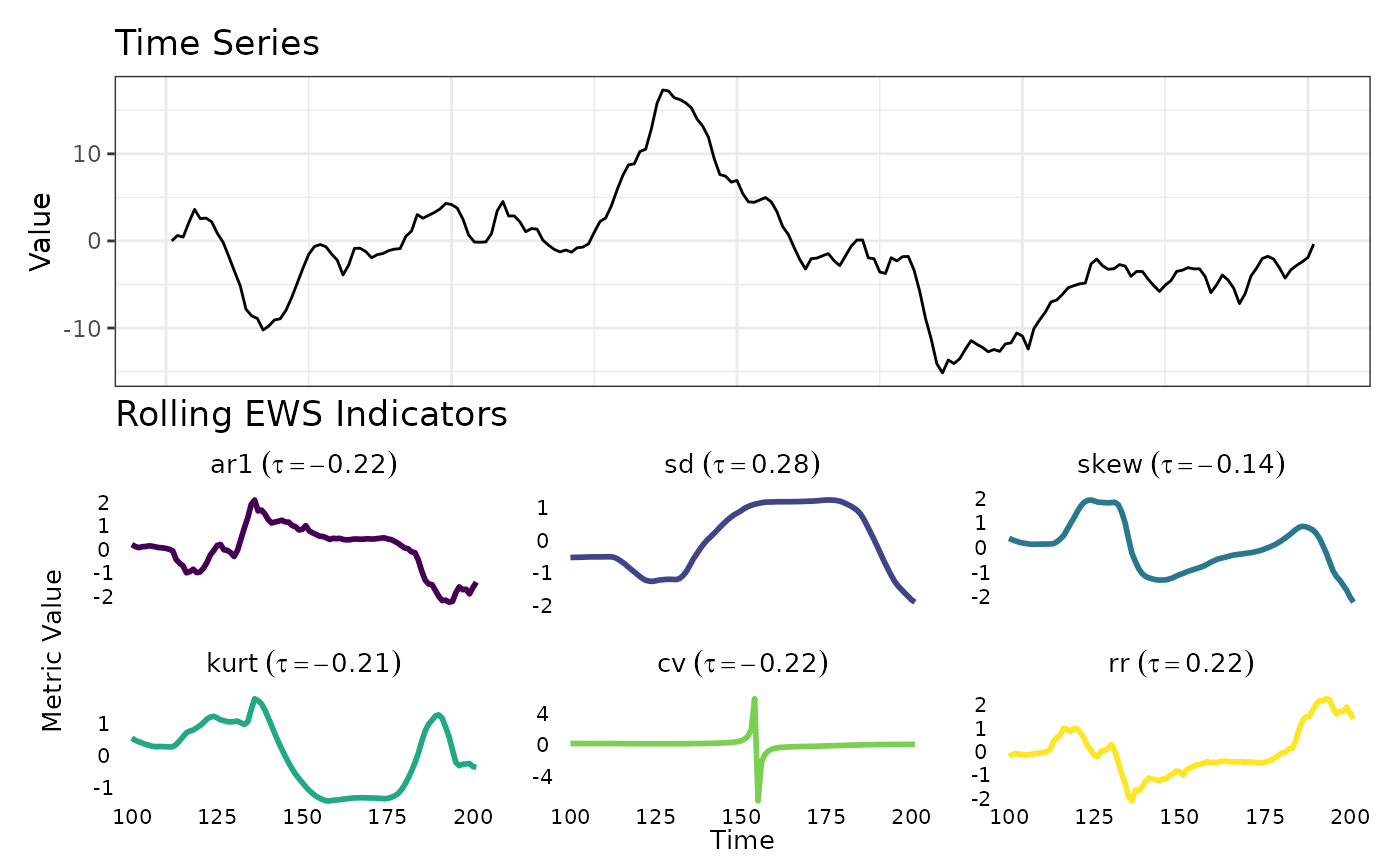
Plot EWS Results
# S3 method for class 'ews'
plot(x, ...)
[ews] Output of detect_warnings().
ews
detect_warnings()
Ignored.
A ggplot object.
ggplot
set.seed(123)
ts_data <- stats::arima.sim(list(order = c(1, 1, 0), ar = 0.6), n = 200)
ews_roll <- detect_warnings(ts_data)
plot(ews_roll)