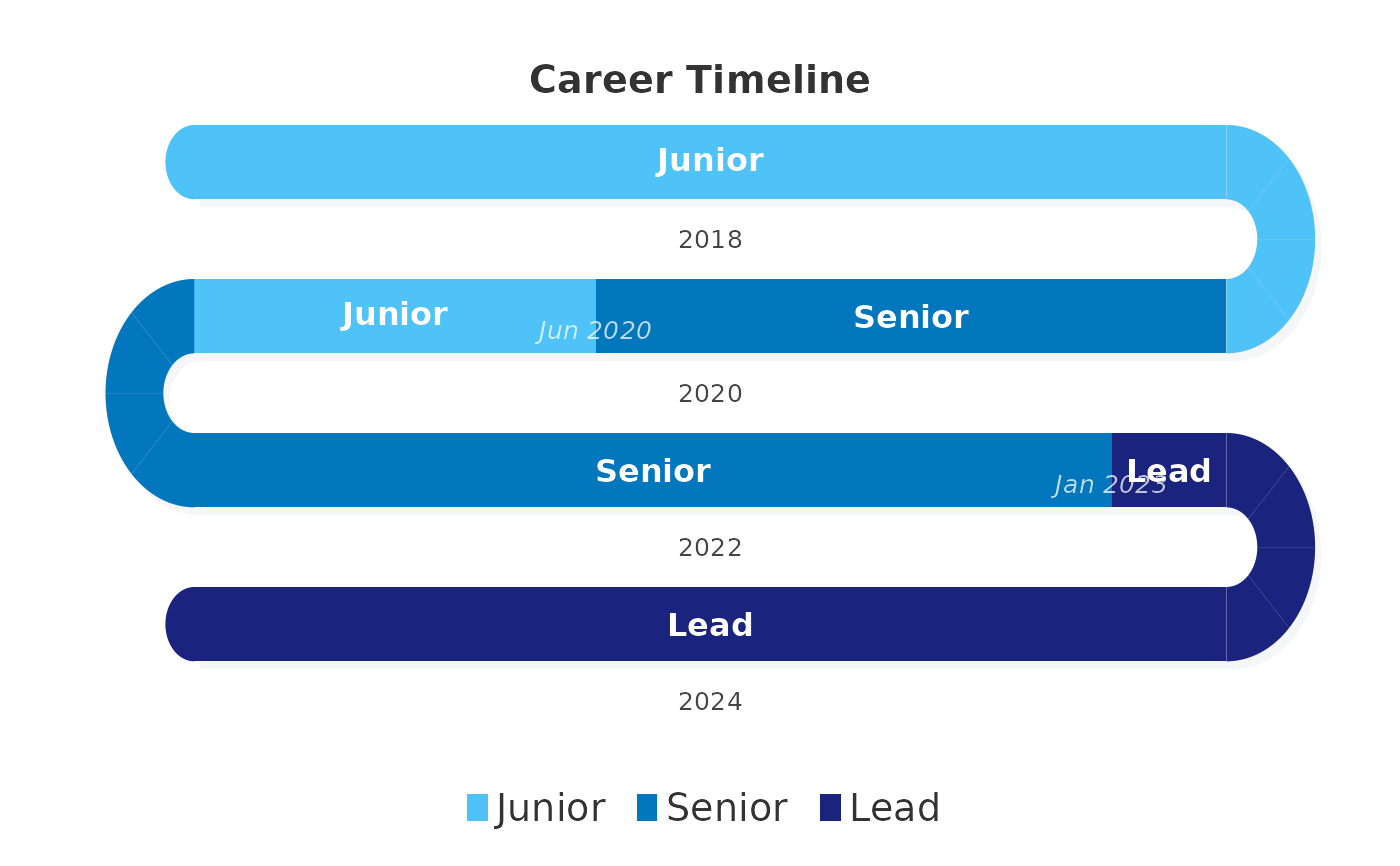
Displays a career or life-event timeline as a serpentine sequence of colored phases. Each block represents one month, colored by the current state/role. State names are overlaid inside runs of consecutive blocks, and transition dates are shown at juncture points where the state changes.
Usage
timeline_snake(
  sequence,
  states = NULL,
  colors = NULL,
  rows = NULL,
  band_height = 28,
  band_gap = 30,
  plot_width = 500,
  margin = c(top = 35, right = 10, bottom = 65, left = 20),
  orientation = "horizontal",
  start_from = "left",
  flow = c("natural", "snake"),
  show_labels = FALSE,
  show_legend = TRUE,
  show_numbers = FALSE,
  show_state = TRUE,
  state_size = 1,
  show_ticks = FALSE,
  tick_labels = NULL,
  transition_labels = NULL,
  transition_pos = NULL,
  tick_color = "#444444",
  tick_length = 6,
  tick_size = 0.8,
  border_color = NA,
  block_labels = NULL,
  band_labels = NULL,
  title = NULL,
  background = "white",
  shadow = TRUE,
  text_size = 0.5,
  legend_text_size = 1.2
)
Arguments
- sequence
Either a character/factor vector of states (one per time unit), or a data.frame with 3 columns: state/role, start date (
"YYYY-MM"or Date), end date. When a data.frame is given, the function auto-generates monthly blocks, transition labels, and band labels.- states
Character vector of unique states in desired order. If
NULL, derived fromunique(sequence).- colors
Named character vector of colors keyed by state, or an unnamed vector recycled to match
states. IfNULL, a built-in qualitative palette is used.- rows
Integer, number of serpentine rows. If
NULL, auto-calculated targeting approximately 10 blocks per band.- band_height
Numeric, height of each band (default 28).
- band_gap
Numeric, gap between bands (default 18).
- plot_width
Numeric, width of each band (default 500).
- margin
Named numeric vector with top, right, bottom, left margins (default
c(top = 35, right = 10, bottom = 65, left = 20)).- orientation
Character,
"horizontal"(default) or"vertical".- start_from
Character,
"left"(default) or"right".- flow
Character,
"natural"(default) or"snake"."natural"reads all bands left-to-right;"snake"uses alternating boustrophedon direction.- show_labels
Logical, show position range labels (default
FALSE).- show_legend
Logical, draw color legend (default
TRUE).- show_numbers
Logical, print small position numbers inside blocks (default
FALSE).- show_state
Logical, show state names inside blocks (default
TRUE).- state_size
Numeric, state label size (default 1).
- show_ticks
Logical, draw ruler-style tick marks at block boundaries outside the bands (default
FALSE).- tick_labels
Character vector of labels for evenly spaced ruler marks within each band (e.g.,
month.abbfor monthly ticks). Impliesshow_ticks = TRUE.- transition_labels
Character vector of date labels for state transition points (e.g.,
c("Oct 2017", "Apr 2019")). One label per transition (length = number of state changes).- transition_pos
Numeric vector of fractional block positions for transition labels (e.g.,
c(6.5, 24.3)). When provided, labels are placed at exact interpolated positions along the serpentine path rather than at state-change boundaries.- tick_color
Color for tick marks (default
"#333333").- tick_length
Numeric, length of tick marks in pixels (default 5).
- tick_size
Numeric, text size for band and transition labels (default 0.8).
- border_color
Color for thin borders between blocks, or
NAfor no borders (defaultNA).- block_labels
Optional character vector of labels to display inside each block (same length as
sequence). Overridesshow_numbers.- band_labels
Character vector of labels to display centered below each band (e.g., year labels). Length must equal
rows.- title
Optional character string for plot title.
- background
Background color (default
"white").- shadow
Logical, draw drop shadows (default
TRUE).- text_size
Numeric, text size multiplier for block labels (default 0.5).
- legend_text_size
Numeric, legend text size (default 1.2).
Examples
# Data.frame input (easiest)
career <- data.frame(
  role  = c("Junior", "Senior", "Lead"),
  start = c("2018-01", "2020-06", "2023-01"),
  end   = c("2020-05", "2022-12", "2024-12")
)
timeline_snake(career, title = "Career Timeline")