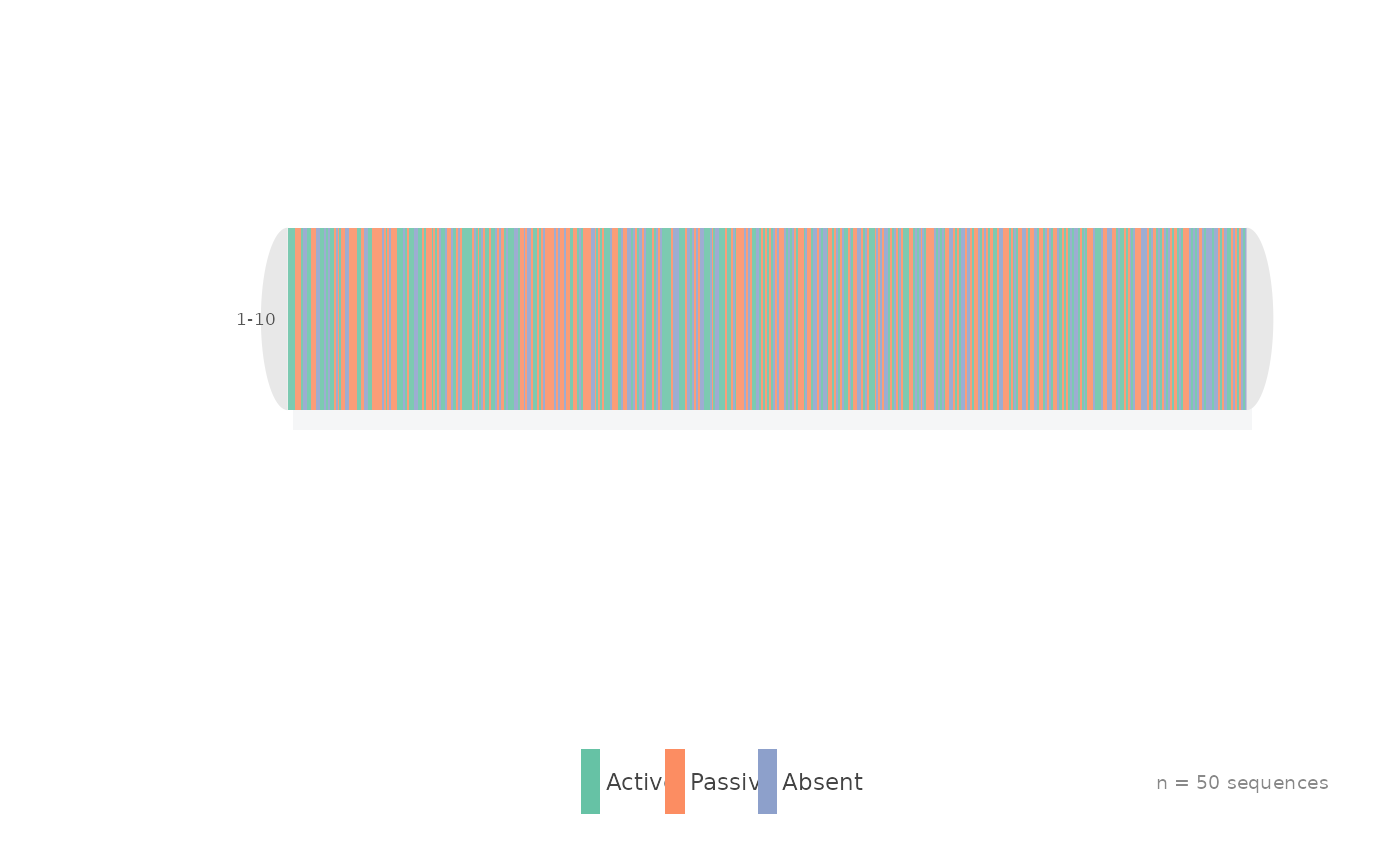
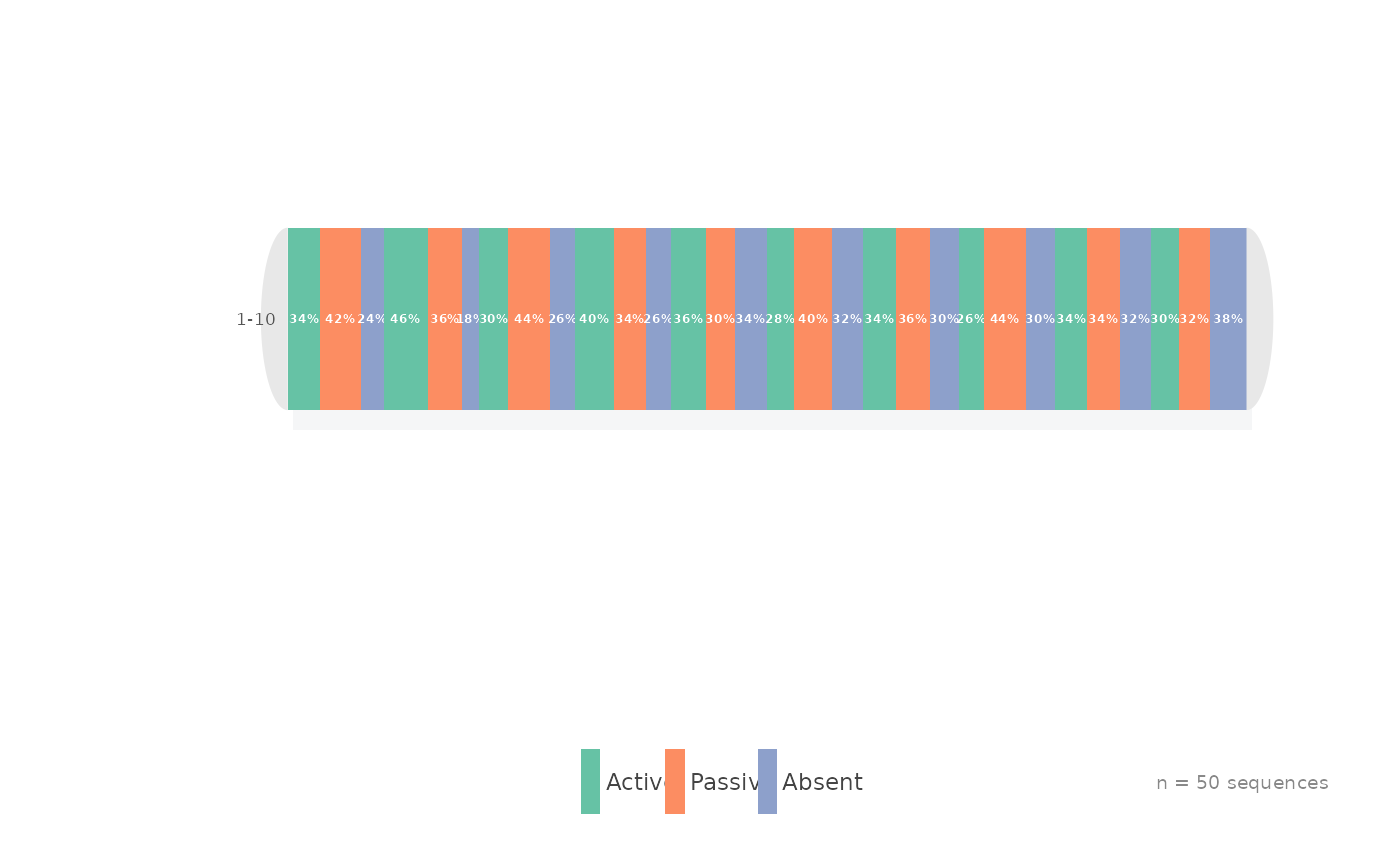
Displays many sequences simultaneously in a serpentine layout. Time points
are packed as blocks within each band (like sequence_snake), with
multiple time points flowing through bands and arcs.
Usage
multi_snake(
  sequences,
  type = c("index", "distribution"),
  states = NULL,
  colors = NULL,
  sort_by = c("none", "first", "last", "freq", "entropy"),
  rows = NULL,
  band_height = 28,
  band_gap = 18,
  plot_width = 500,
  margin = c(top = 30, right = 10, bottom = 50, left = 80),
  flow = c("snake", "natural"),
  show_labels = TRUE,
  show_legend = TRUE,
  show_percent = TRUE,
  border_color = NA,
  title = NULL,
  background = "white",
  shadow = TRUE,
  legend_text_size = 0.8,
  tick_opacity = 0.85
)
Arguments
- sequences
Matrix or data.frame where rows are sequences and columns are time points. Each cell contains a state label.
- type
Character,
"index"(default) or"distribution".- states
Character vector of unique states in desired legend order. If
NULL, derived from the data.- colors
Named or unnamed character vector of colors. If
NULL, a built-in qualitative palette is used.- sort_by
Character controlling sequence order in index mode:
"none"(default),"first"(sort by first state),"last"(sort by last state),"freq"(sort by most frequent state), or"entropy"(sort by Shannon entropy).- rows
Integer, number of serpentine rows. If
NULL, auto-calculated (~10 blocks per band).- band_height
Numeric, height of each band in pixels (default 28).
- band_gap
Numeric, gap between bands (default 18).
- plot_width
Numeric, width of each band (default 500).
- margin
Named numeric vector with top, right, bottom, left margins.
- flow
Character,
"snake"(default) or"natural"."snake"uses alternating boustrophedon direction;"natural"reads all bands in the same direction.- show_labels
Logical, show time-point range per row (default TRUE).
- show_legend
Logical, draw color legend (default TRUE).
- show_percent
Logical, show percentage labels inside distribution bars (default TRUE). Only used when
type = "distribution".- border_color
Color for thin borders between blocks, or
NAfor no borders (defaultNA).- title
Optional character string for plot title.
- background
Background color (default
"white").- shadow
Logical, draw drop shadows (default TRUE).
- legend_text_size
Numeric, legend text size (default 0.8).
- tick_opacity
Numeric 0-1, opacity of ticks in index mode (default 0.85).
Details
Two display modes are supported:
"index"Each block contains thin colored ticks stacked side by side — one tick per sequence, colored by state at that time point. Like TraMineR's
seqiplot()folded into a serpentine."distribution"Each block is a stacked proportional bar showing what fraction of sequences is in each state at that time point. Like TraMineR's
seqdplot().