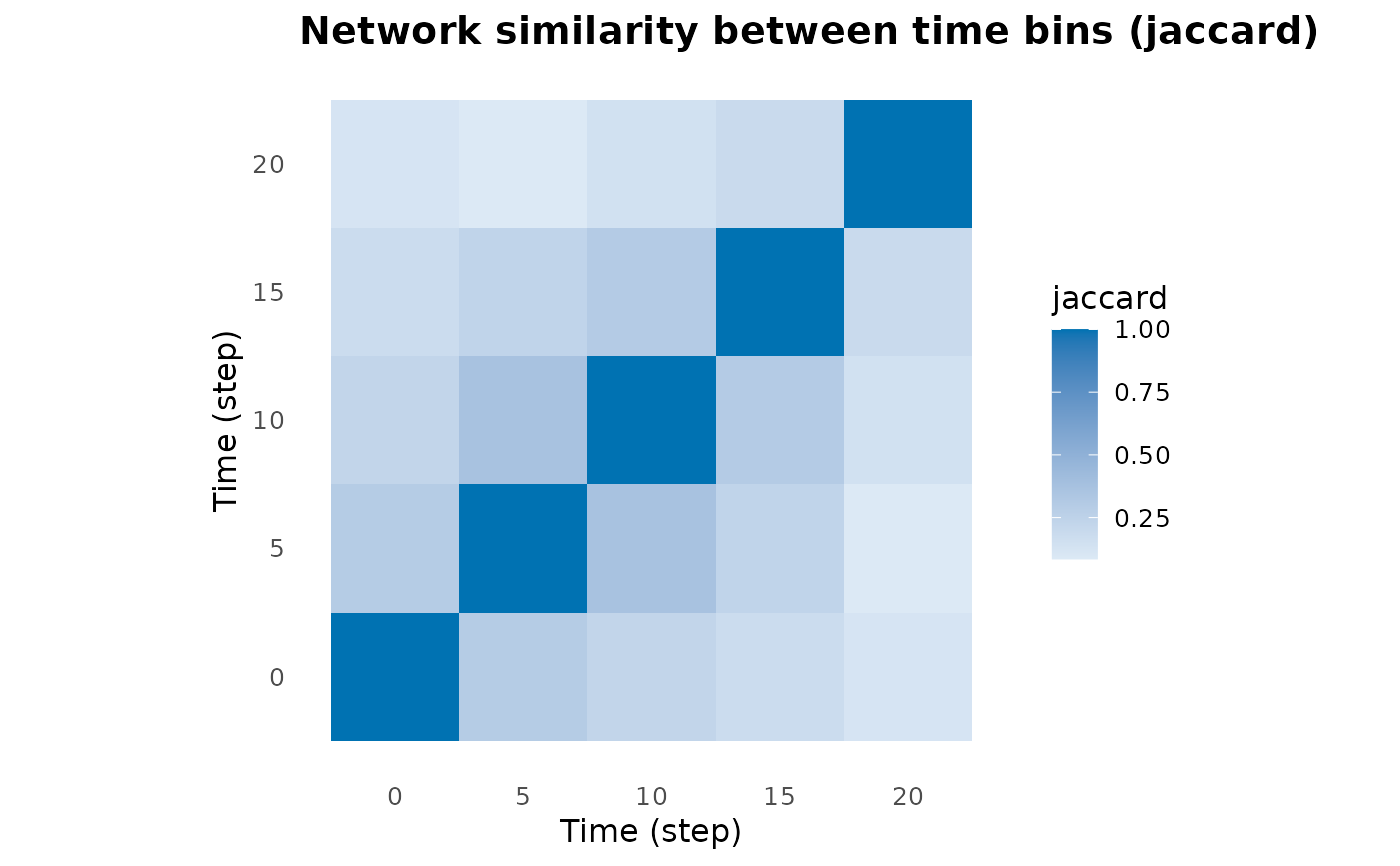
Draw time-bin similarity as a heatmap
Usage
# S3 method for class 'dynet_similarity'
plot(x, base_size = 12, ...)
Arguments
- x
A result from
similarity().- base_size
Base text size. Defaults to twelve.
- ...
Ignored.
Value
A ggplot object. Drawing happens when that object is printed, so
the plot is the return value here rather than a side effect.
Examples
dn <- dynet(school_contacts)
bin_similarity <- similarity(dn, step = 5, window = 5)
plot(bin_similarity)