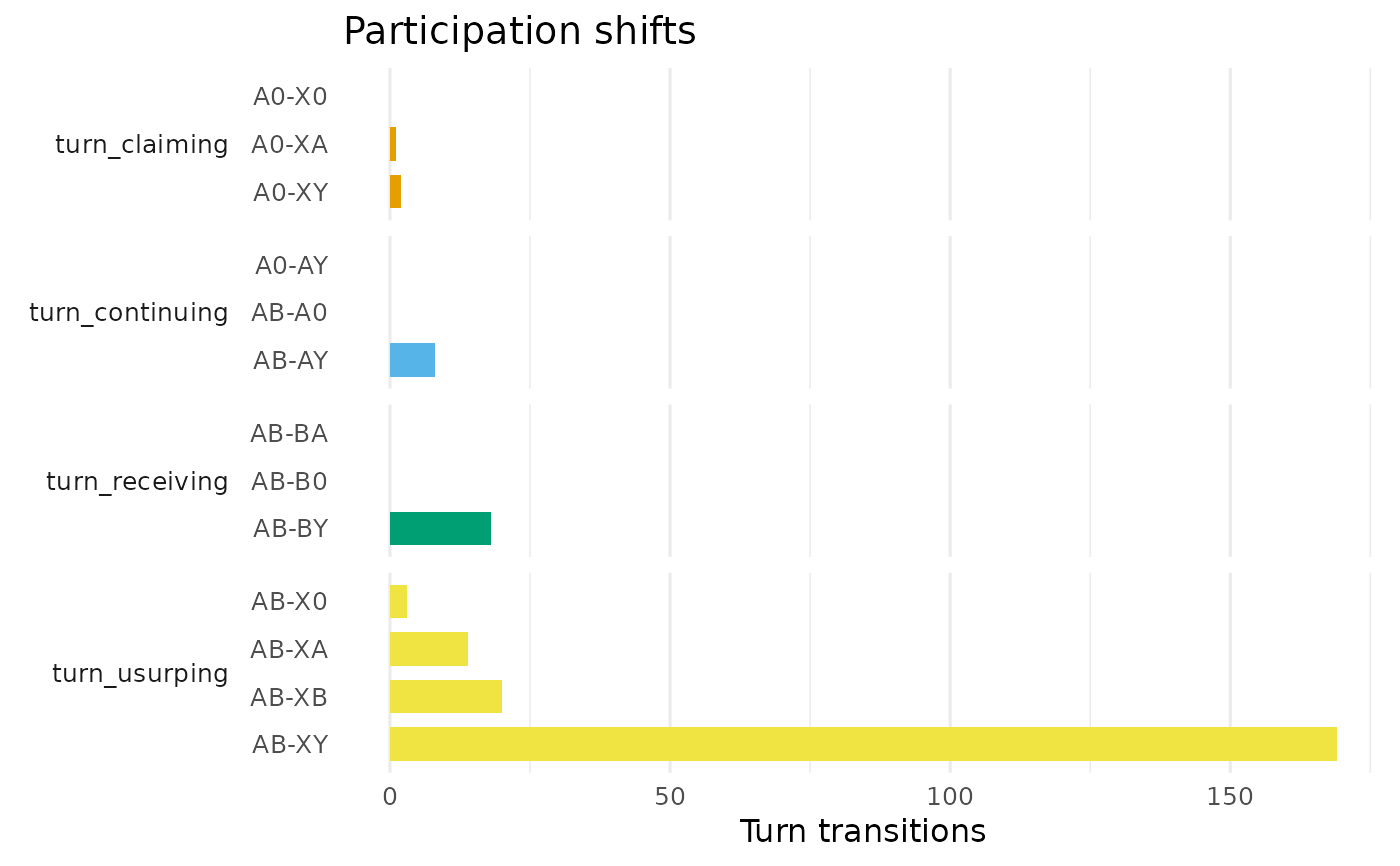
One horizontal bar per shift type, grouped and coloured by family. Families are distinguished by a direct axis grouping as well as by fill, so the figure does not rely on colour alone.
Usage
# S3 method for class 'dynet_pshifts'
plot(x, ...)One horizontal bar per shift type, grouped and coloured by family. Families are distinguished by a direct axis grouping as well as by fill, so the figure does not rely on colour alone.
# S3 method for class 'dynet_pshifts'
plot(x, ...)