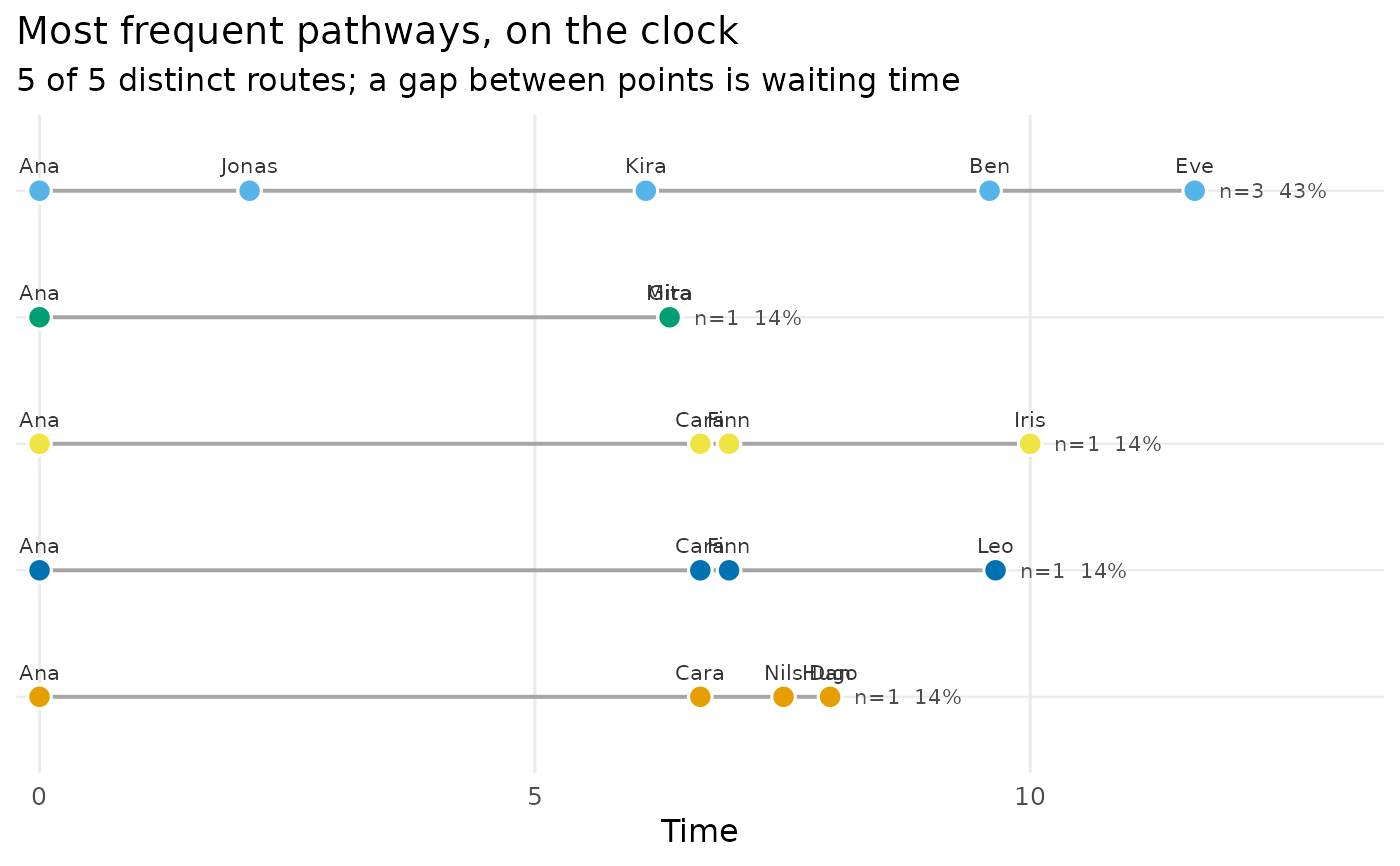
One row per route, drawn along real time: a point at each vertex placed at the moment the route reaches it, joined by a segment. The horizontal gap between two points is the waiting time at that vertex, so the drawing is time-respecting in the way a bar of a route string is not – a route that waits is visibly slower than one that does not, and where routes arrive relative to each other is read off the axis.
Usage
# S3 method for class 'dynet_pathways'
plot(x, top = 12L, labels = TRUE, base_size = 12, ...)
Arguments
- x
A
dynet_pathwaysresult.- top
Number of routes to draw, most frequent first. Defaults to twelve, which keeps the vertex labels legible.
- labels
Whether to name the vertex at each step.
TRUEby default; turn it off for a dense figure where the shape is the point.- base_size
Base font size, as in
ggplot2::theme_minimal(). Defaults to twelve.- ...
Ignored.
Value
A ggplot object. A top, labels or base_size that is not one
valid value raises dynet_bad_input.